Free printable practice
Data Graphing Practice Activities
Printable Grade 1 data graphing worksheets for collecting, sorting, tallying, reading bar charts, and interpreting pictographs.
Explore Data Graphing
Free printable worksheet PDFs
Preview every available page, then download the free worksheet PDF for home, homeschool, tutoring, or classroom practice.
Preview the exact activity before downloading it.
 Bar Charts — Concept FoundationsConcept Foundations for bar charts in Grade 1. Read one simple bar chart, then count bars and compare their heights to answer questions.Grade 1Free PDF preview
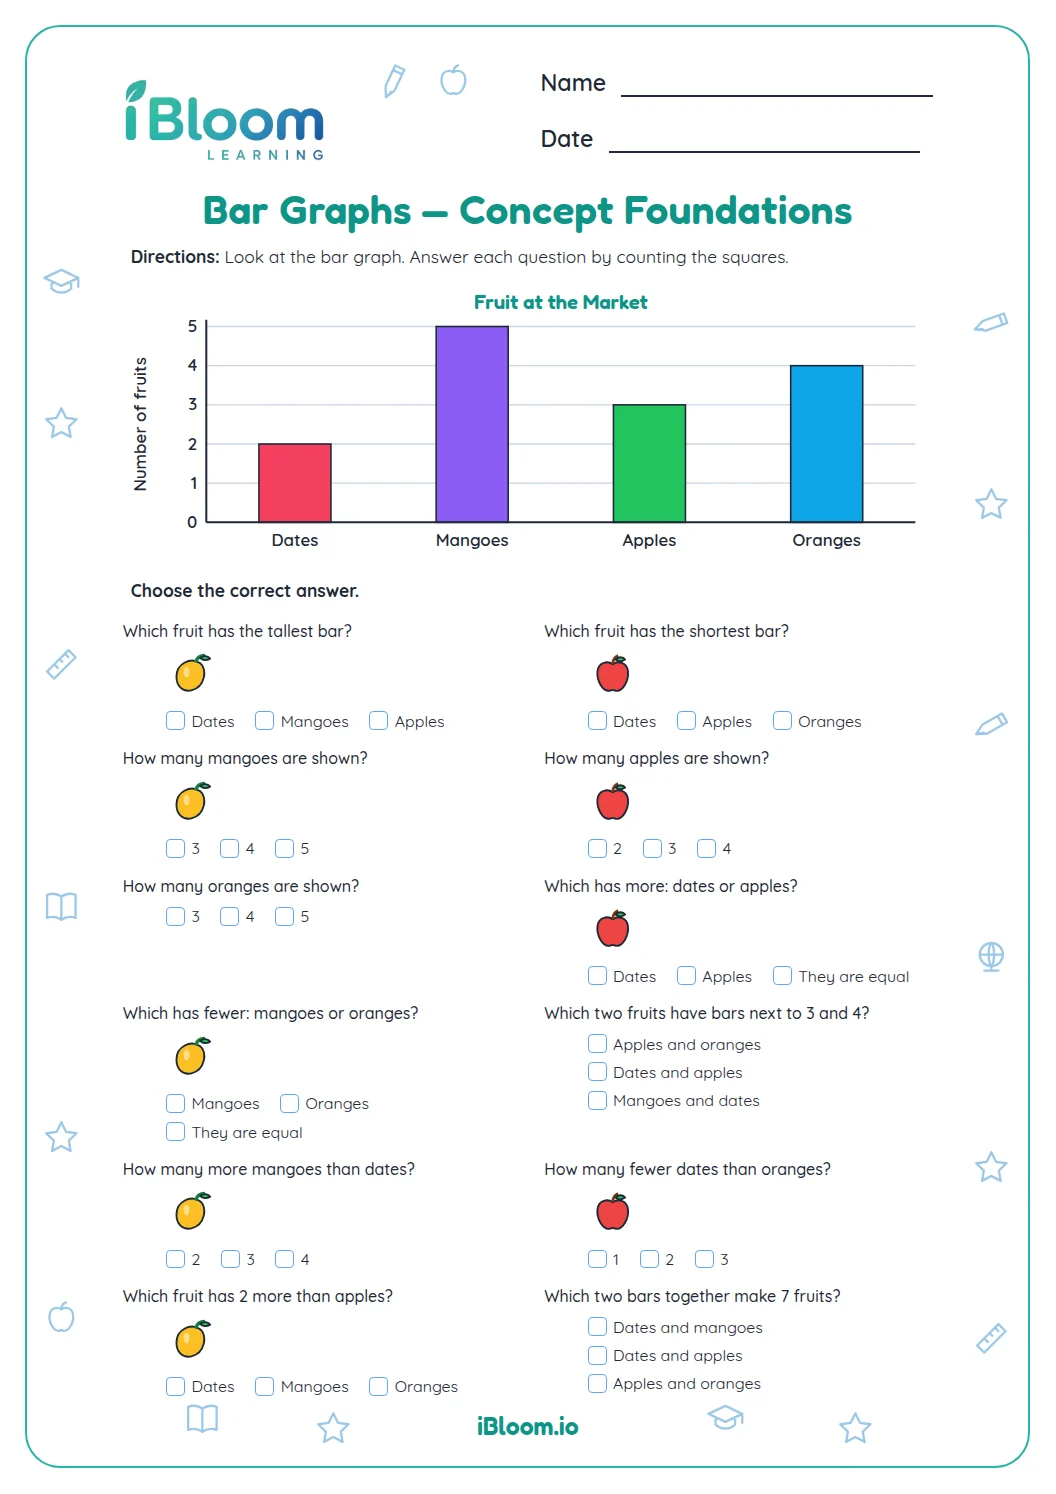 Bar Graphs — Concept FoundationsConcept Foundations for bar graphs in Grade 1. Read the bar graph, count each bar, and compare categories using more, fewer, and equal.Grade 1Free PDF preview
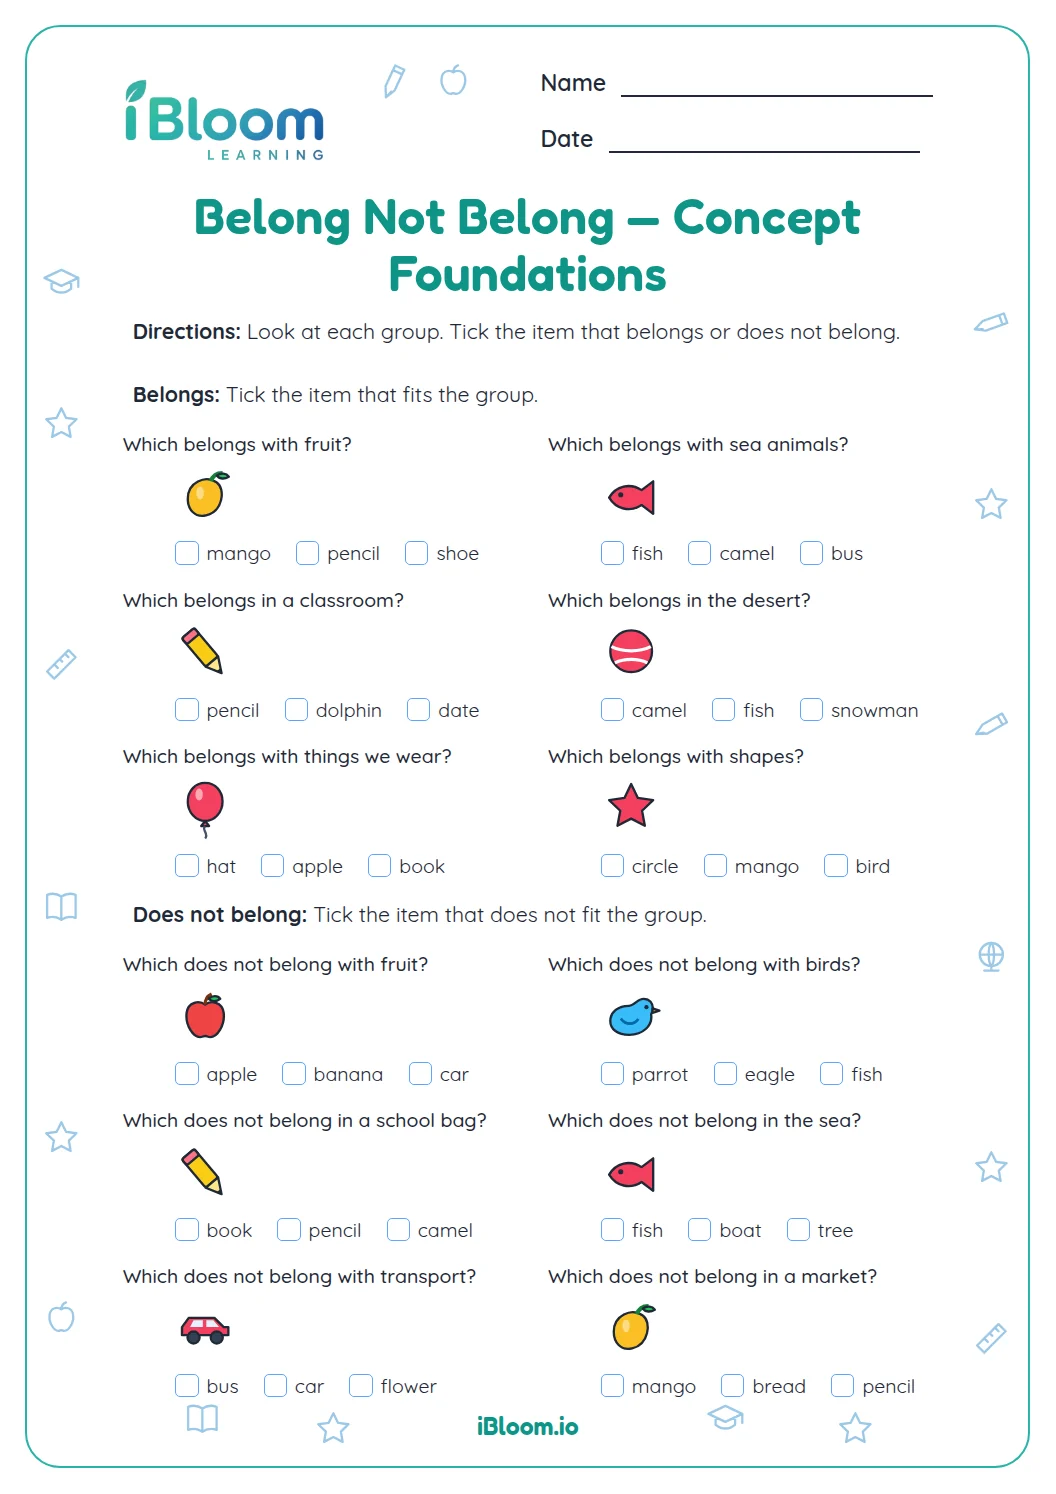 Belong Not Belong — Concept FoundationsConcept Foundations for belong not belong in Grade 1. Choose which item belongs or does not belong in each simple group, using familiar objects, animals, foods, and places.Grade 1Free PDF preview
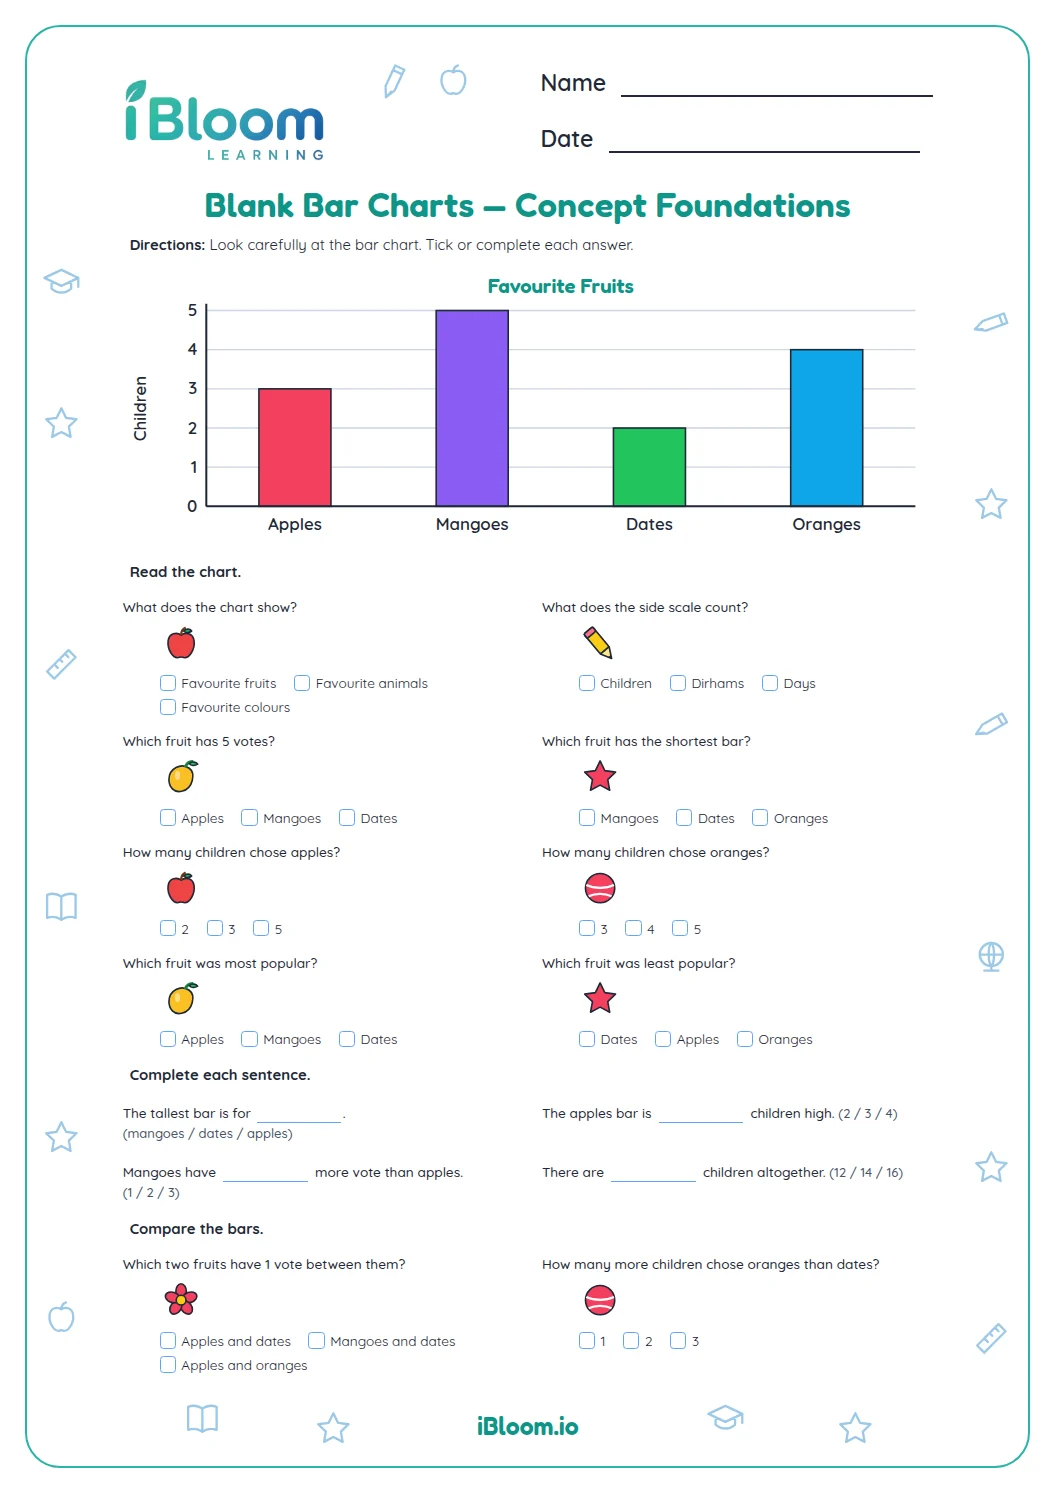 Blank Bar Charts — Concept FoundationsConcept Foundations for blank bar charts in Grade 1. Read a simple bar chart, identify its title, labels, scale and bar heights, then compare and count the data.Grade 1Free PDF preview
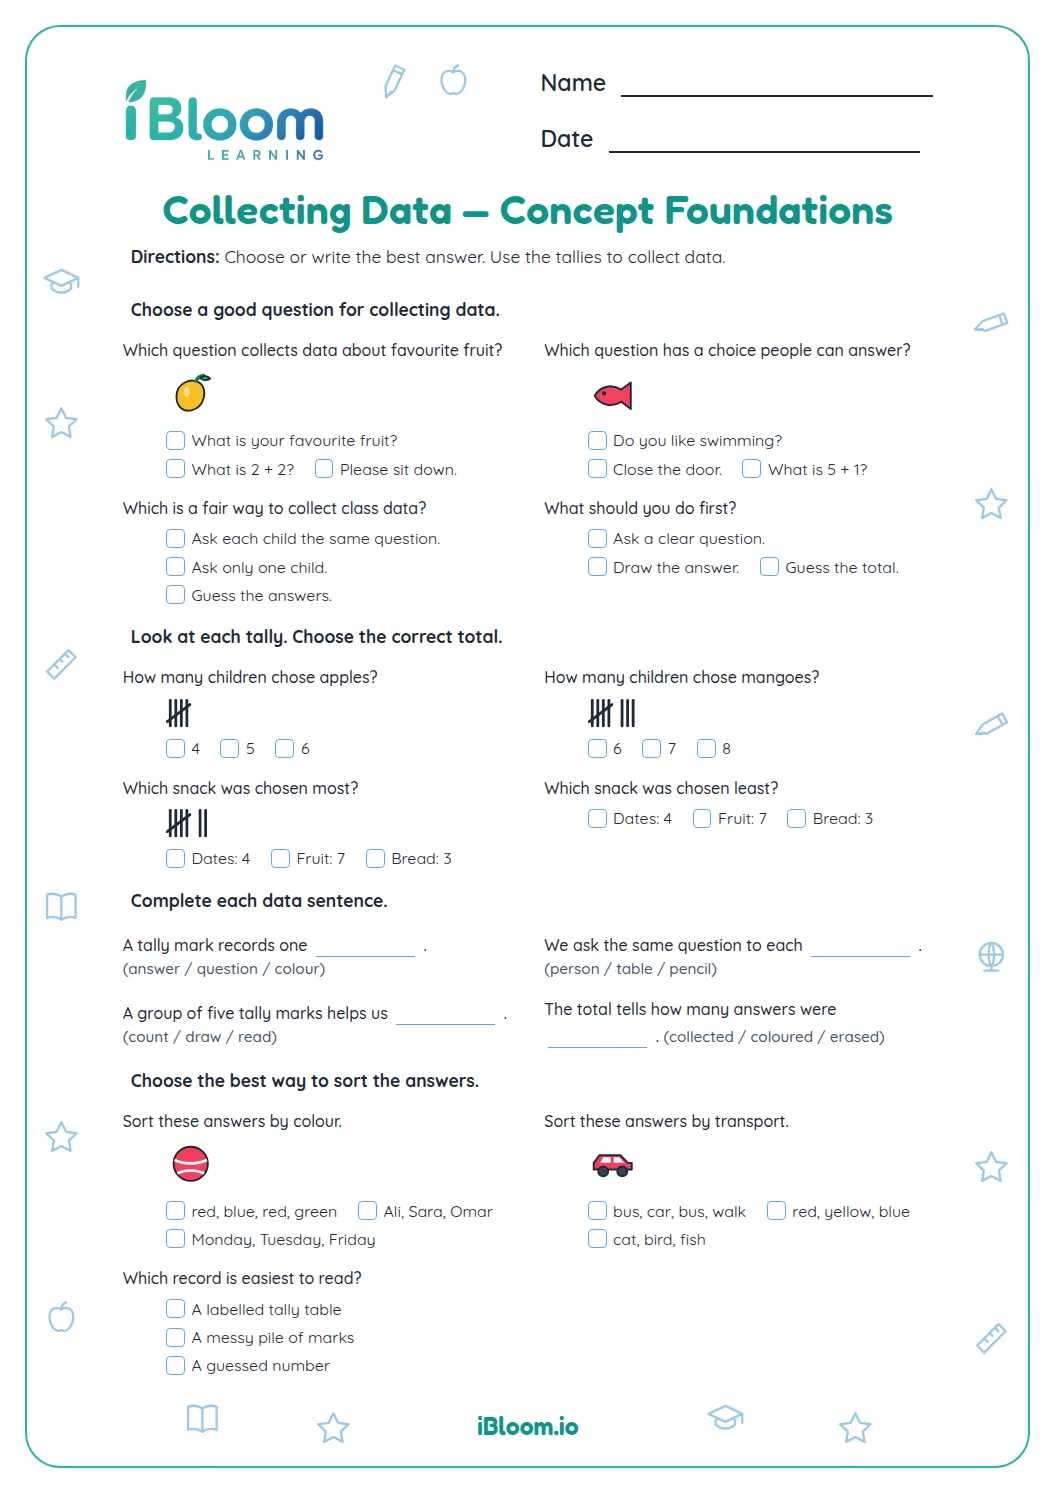 Collecting Data — Concept FoundationsConcept Foundations for collecting data in Grade 1. Choose good data questions, sort answers, and read or complete simple tally records.Grade 1Free PDF preview
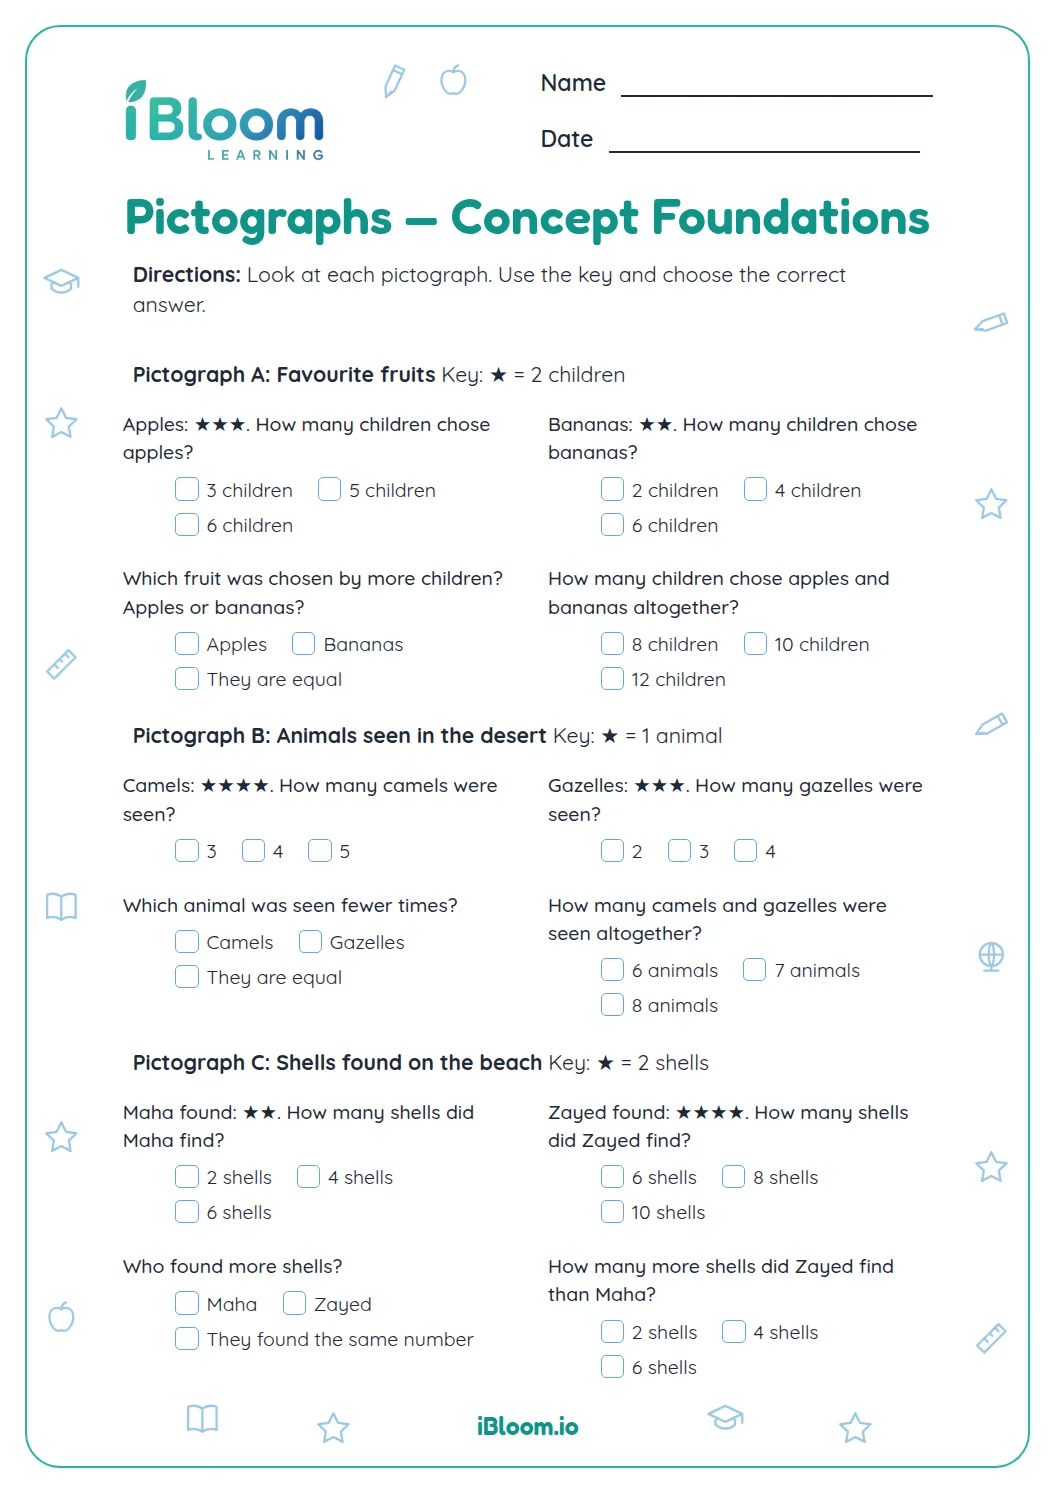 Pictographs — Concept FoundationsConcept Foundations for pictographs in Grade 1. Read three simple pictographs, use the key to count pictures, compare categories, and answer questions.Grade 1Free PDF preview
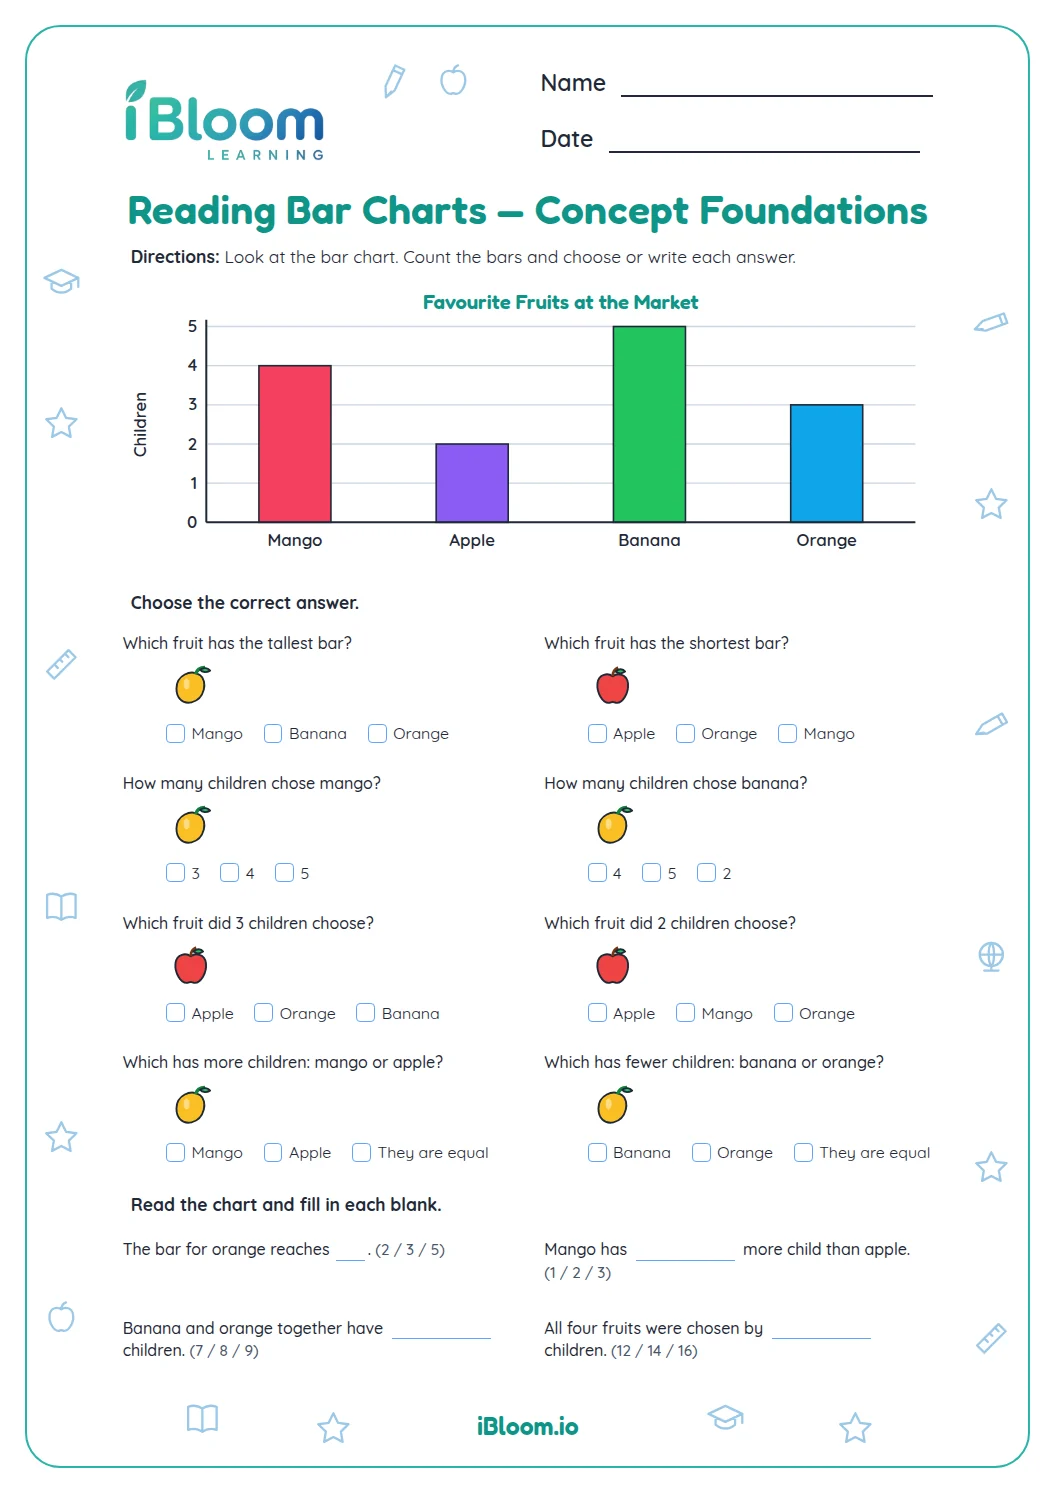 Reading Bar Charts — Concept FoundationsConcept Foundations for reading bar charts in Grade 1. Read the bar chart, identify its scale and categories, then answer questions by counting and comparing bars.Grade 1Free PDF preview
 Same Different — Concept FoundationsConcept Foundations for same different in Grade 1. Look at each pair of objects and choose whether they are the same or different.Grade 1Free PDF preview
 Sort And Count — Concept FoundationsConcept Foundations for sort and count in Grade 1. Sort familiar objects into clear groups, then count the objects in each group and record the totals.Grade 1Free PDF preview
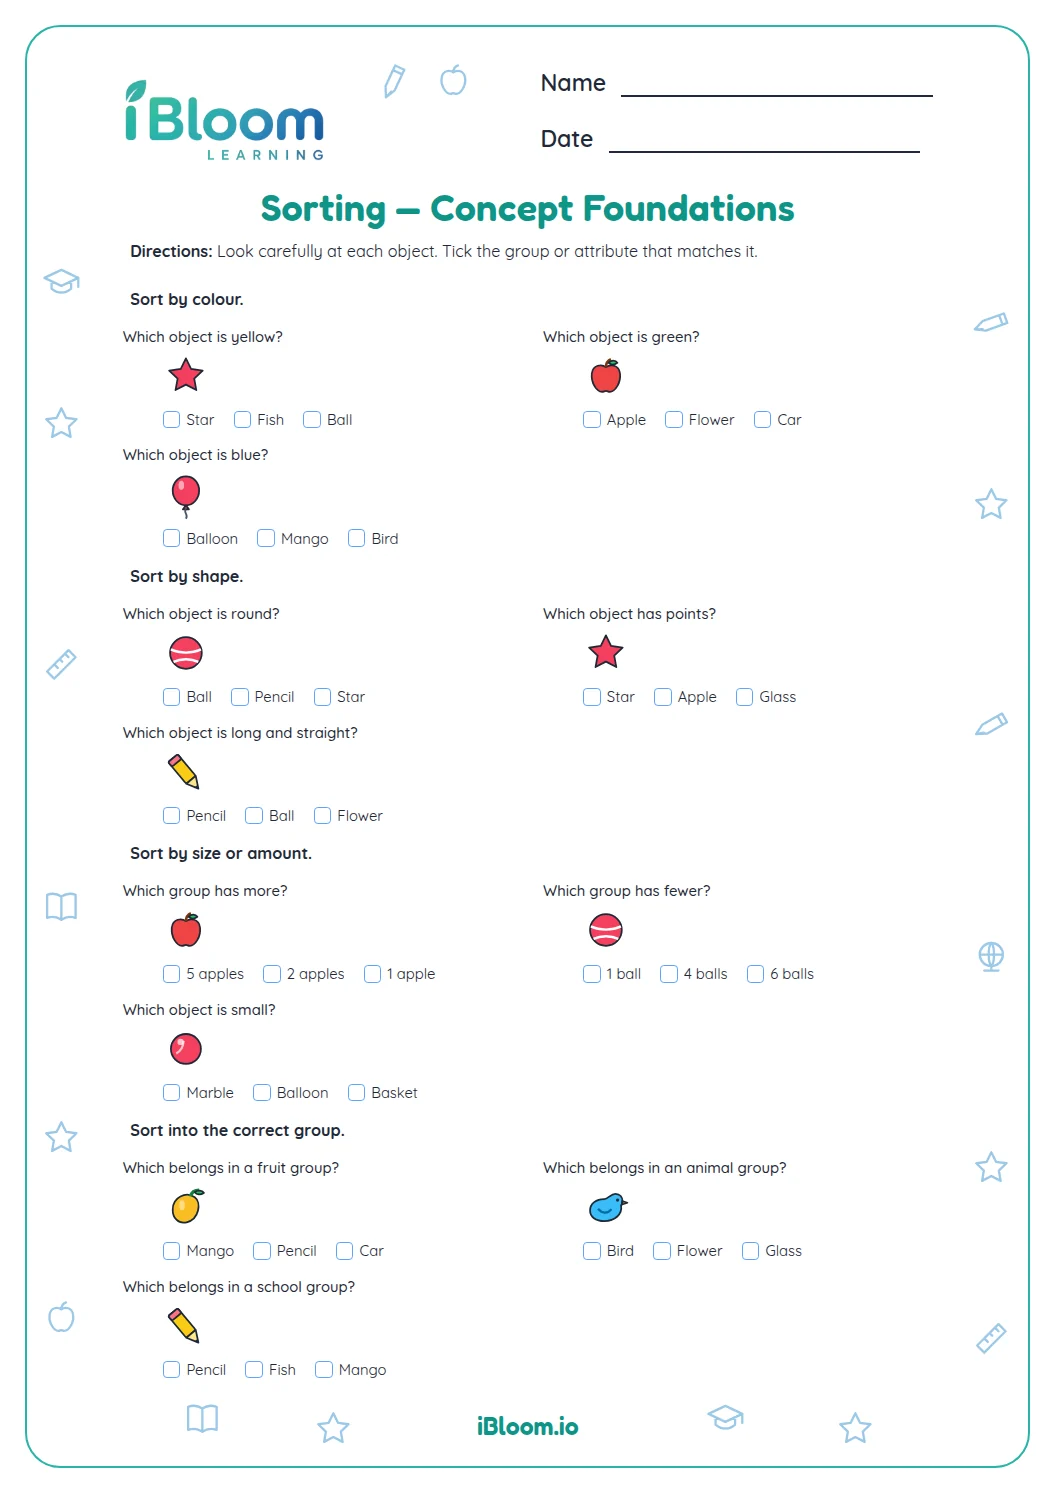 Sorting — Concept FoundationsConcept Foundations for sorting in Grade 1. Look at each object and choose the group or attribute it belongs to, starting with simple colour and shape sorts.Grade 1Free PDF preview
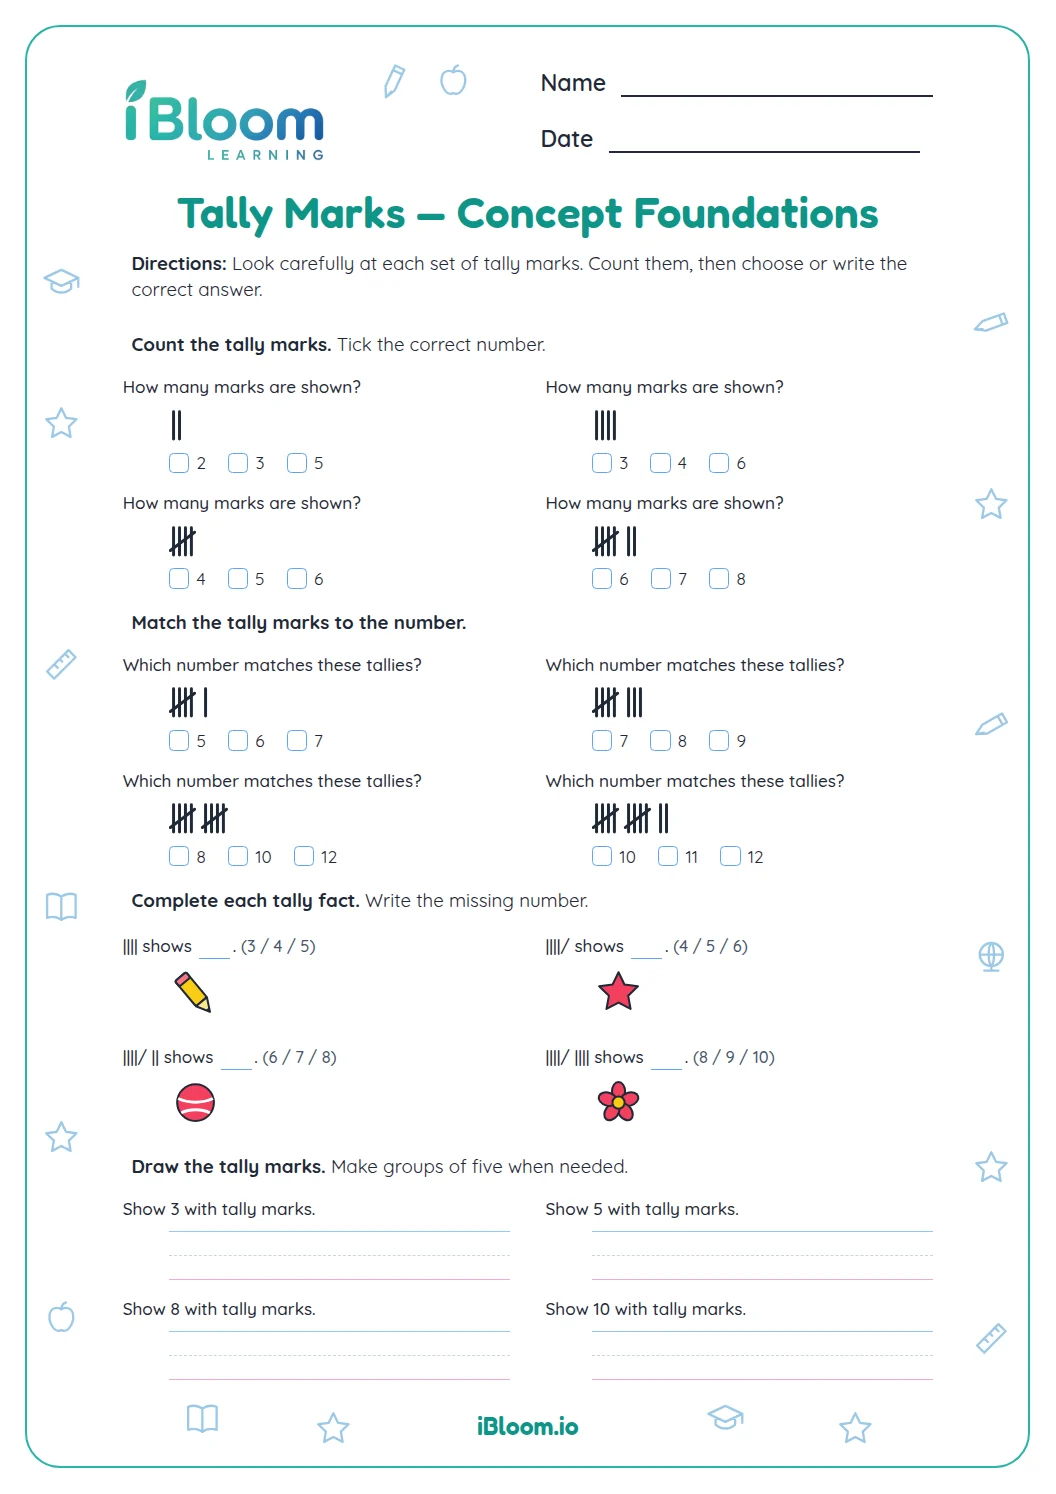 Tally Marks — Concept FoundationsConcept Foundations for tally marks in Grade 1. Count tally marks, recognise groups of five, match tallies to numbers, and record simple totals.Grade 1Free PDF preview
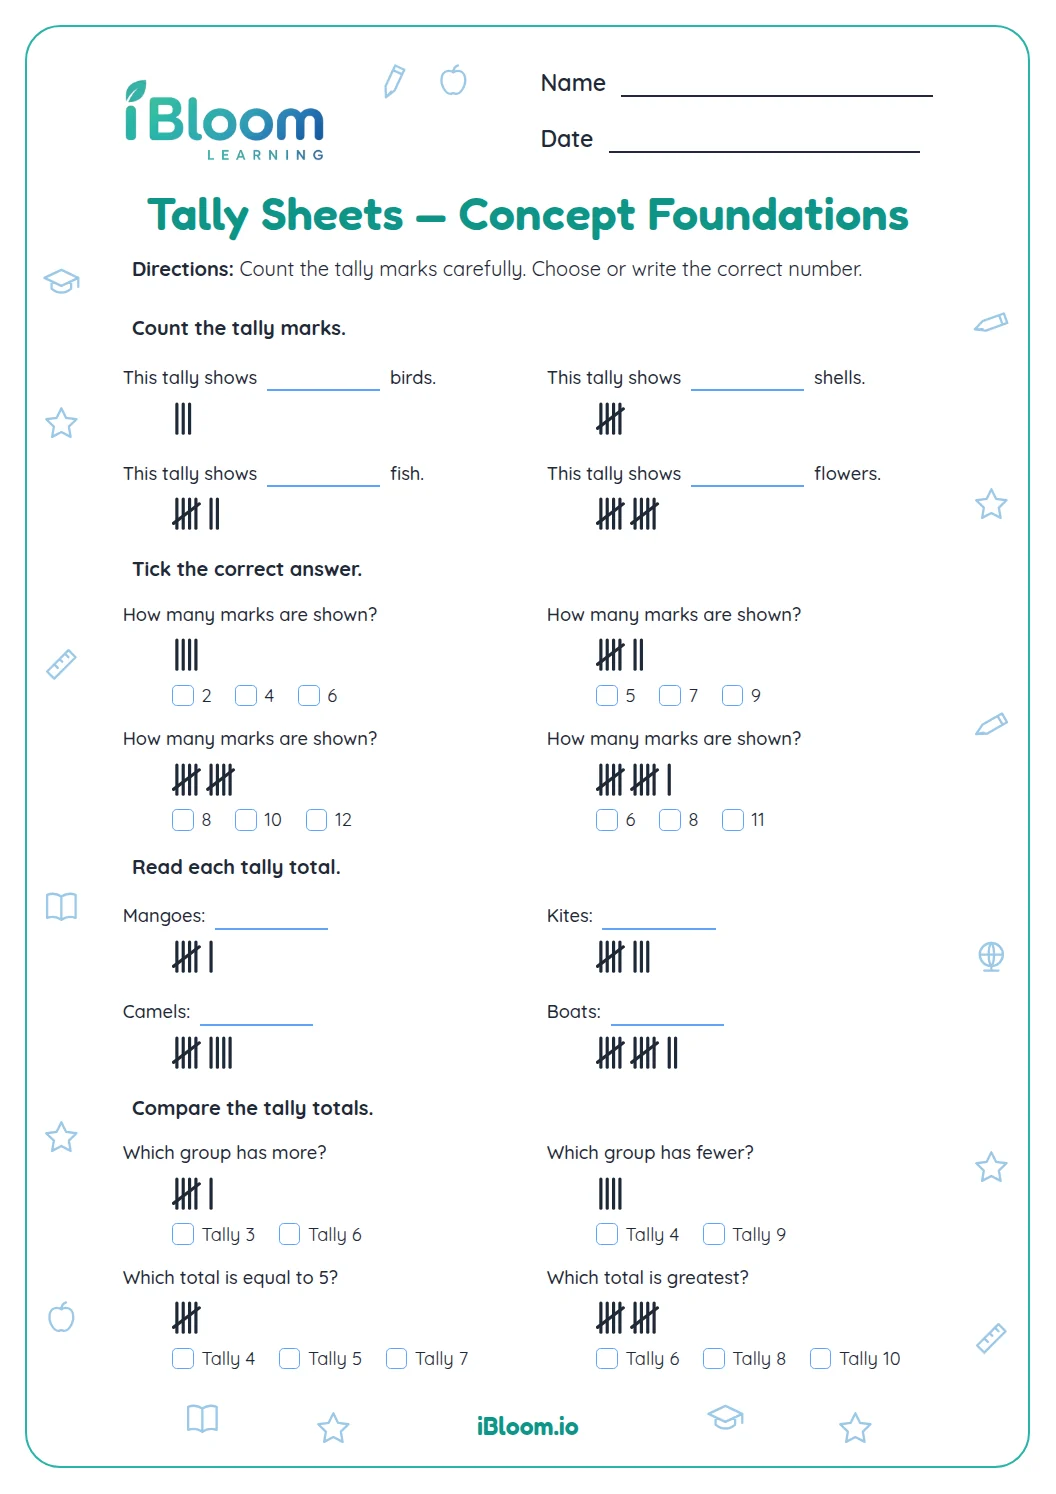 Tally Sheets — Concept FoundationsConcept Foundations for tally sheets in Grade 1. Count tally marks, recognise groups of five, and read simple tally-sheet totals.Grade 1Free PDF preview
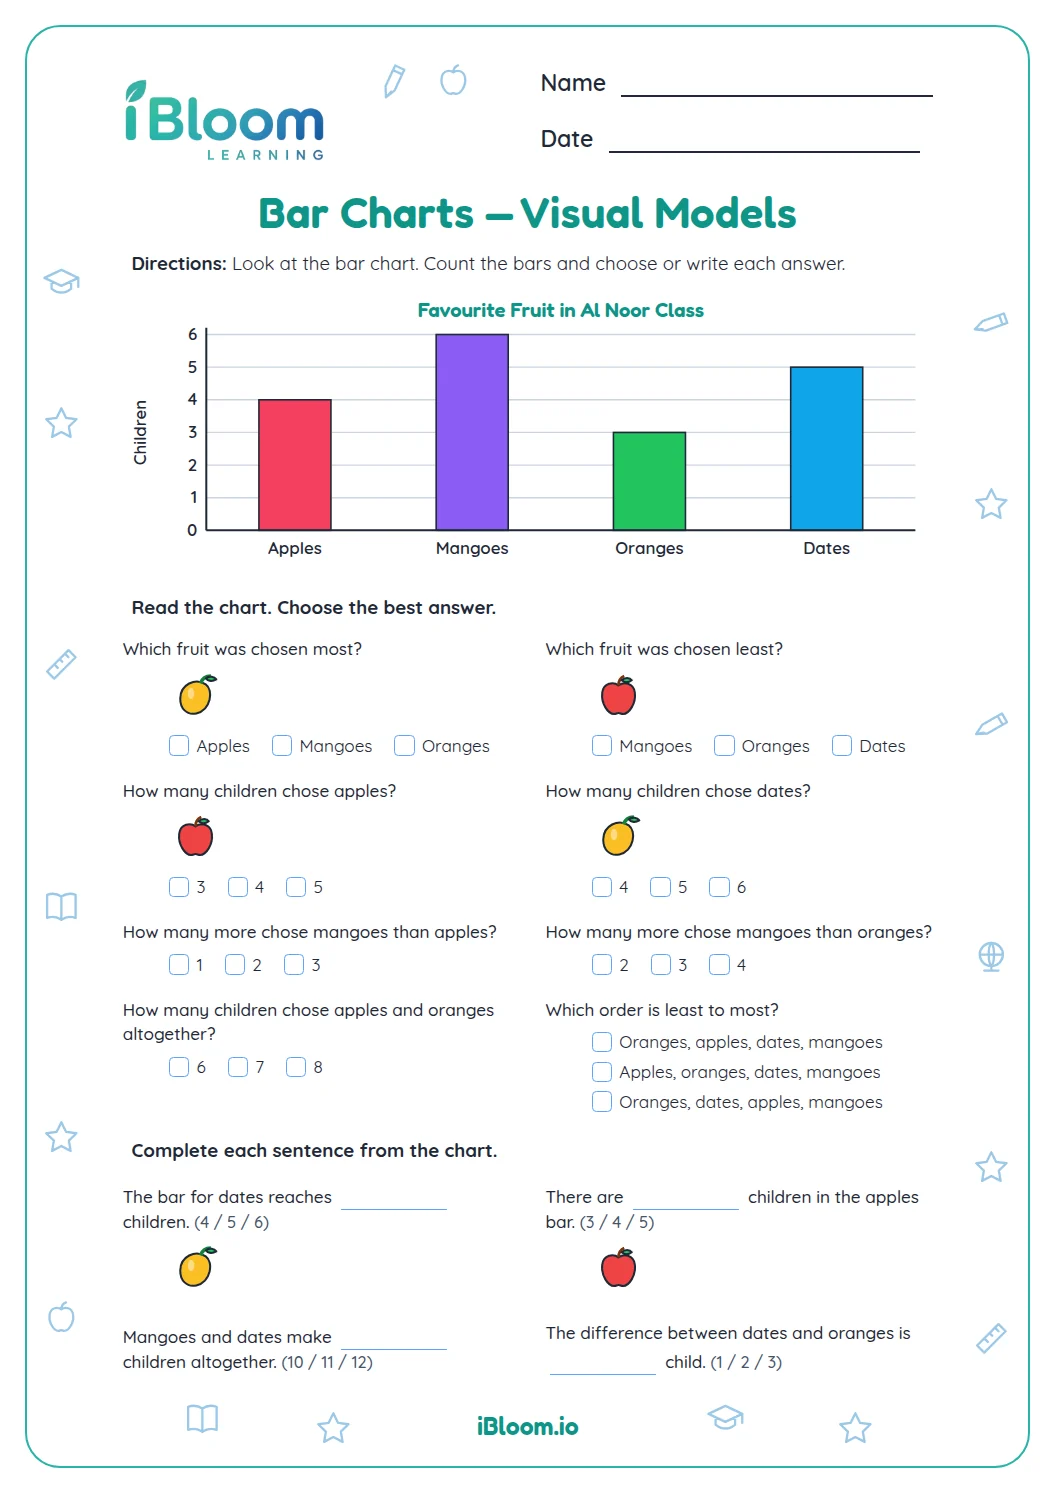 Bar Charts — Visual ModelsVisual Models for bar charts in Grade 1. Read the bar chart, use the bar heights as visual models, and answer questions by counting, comparing, and combining data.Grade 1Free PDF preview
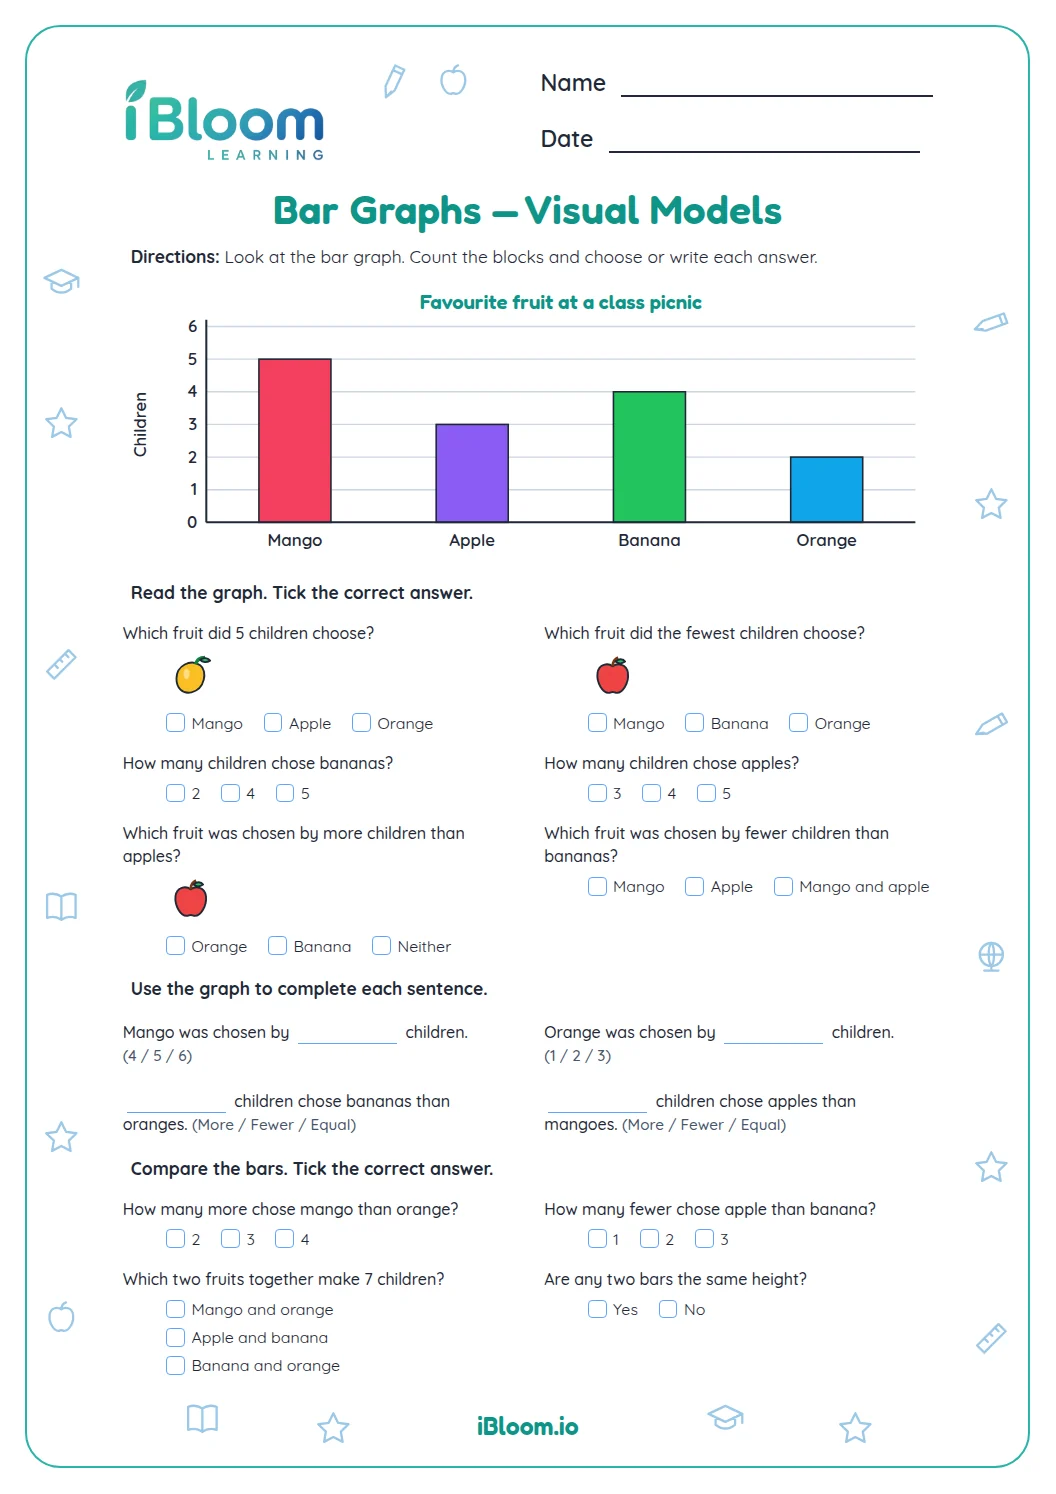 Bar Graphs — Visual ModelsVisual Models for bar graphs in Grade 1. Read the bar graph, count each bar, and compare categories using more, fewer, and equal.Grade 1Free PDF preview
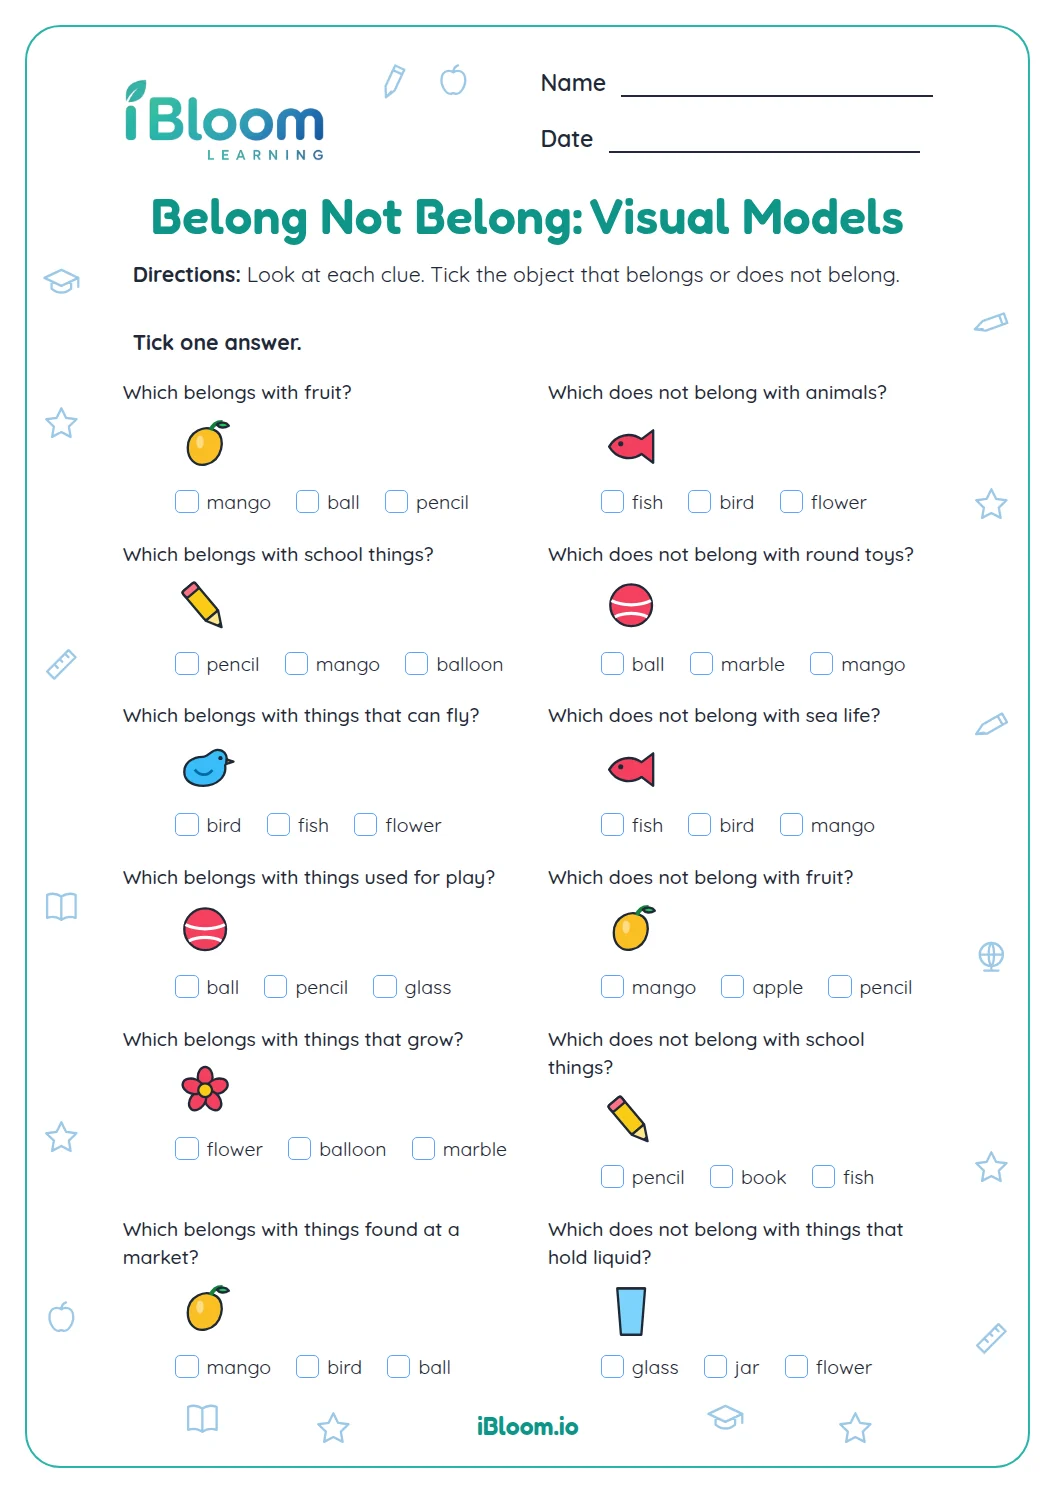 Belong Not Belong — Visual ModelsVisual Models for belong not belong in Grade 1. Look at each visual clue, then choose the object that belongs or does not belong with the group.Grade 1Free PDF preview
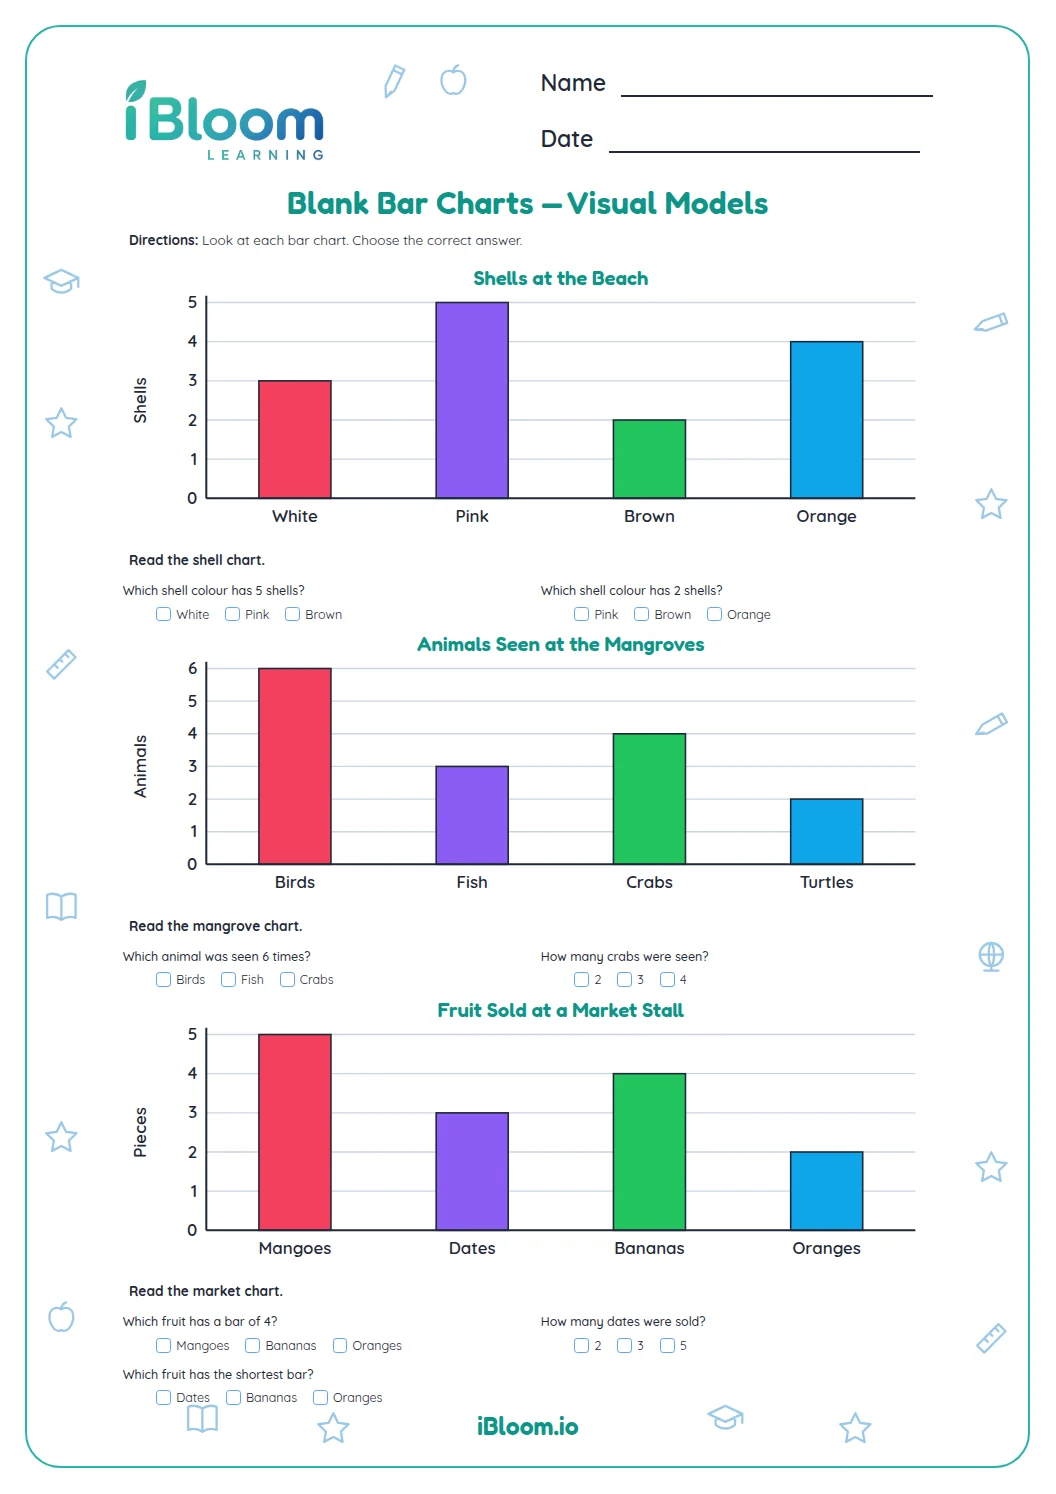 Blank Bar Charts — Visual ModelsVisual Models for blank bar charts in Grade 1. Read three simple bar-chart visual models, then answer questions about bar heights and category counts.Grade 1Free PDF preview
 Collecting Data — Visual ModelsVisual Models for collecting data in Grade 1. Read visual tallies and a bar graph, then record and compare simple data.Grade 1Free PDF preview
 Pictographs — Visual ModelsVisual Models for pictographs in Grade 1. Read each picture model, count the icons, compare groups, and answer pictograph questions.Grade 1Free PDF preview
 Reading Bar Charts — Visual ModelsVisual Models for reading bar charts in Grade 1. Read the market bar chart, count each bar, compare categories, and answer data questions.Grade 1Free PDF preview
 Same Different — Visual ModelsVisual Models for same different in Grade 1. Look at two picture models, compare their features, and choose whether they are the same or different.Grade 1Free PDF preview
Practice that builds confidence
Practise Data Graphing
Printable Grade 1 data graphing worksheets for collecting, sorting, tallying, reading bar charts, and interpreting pictographs.
Printable Grade 1 data graphing worksheets for collecting, sorting, tallying, reading bar charts, and interpreting pictographs.
Explore printable data graphing worksheets for UAE learners. Choose a focused activity that suits the child's stage, model the first example together, and discuss how the child found the answer.

Using a worksheet well
Begin with a short explanation and one worked example. Let the child complete a manageable section, then ask them to explain their answer or show another method. For younger learners, pair the page with real objects, pictures, talk and play. If an item is difficult, return to the prerequisite skill and try again later.
Helpful answers
Frequently asked questions
How should I use these worksheets?
Choose a page that matches the current skill, model one example, and discuss the answers together.
Can I print a worksheet?
Yes. Open a published activity to preview its full printable page before printing.