Free printable practice
Data Graphing Practice Activities
Explore data graphing practice activities within Grade 2 Math Practice, organised so children, families, and elementary teachers can move from broad learning areas to focused printable practice.
Explore Data Graphing
Free printable worksheet PDFs
Preview every available page, then download the free worksheet PDF for home, homeschool, tutoring, or classroom practice.
Preview the exact activity before downloading it.
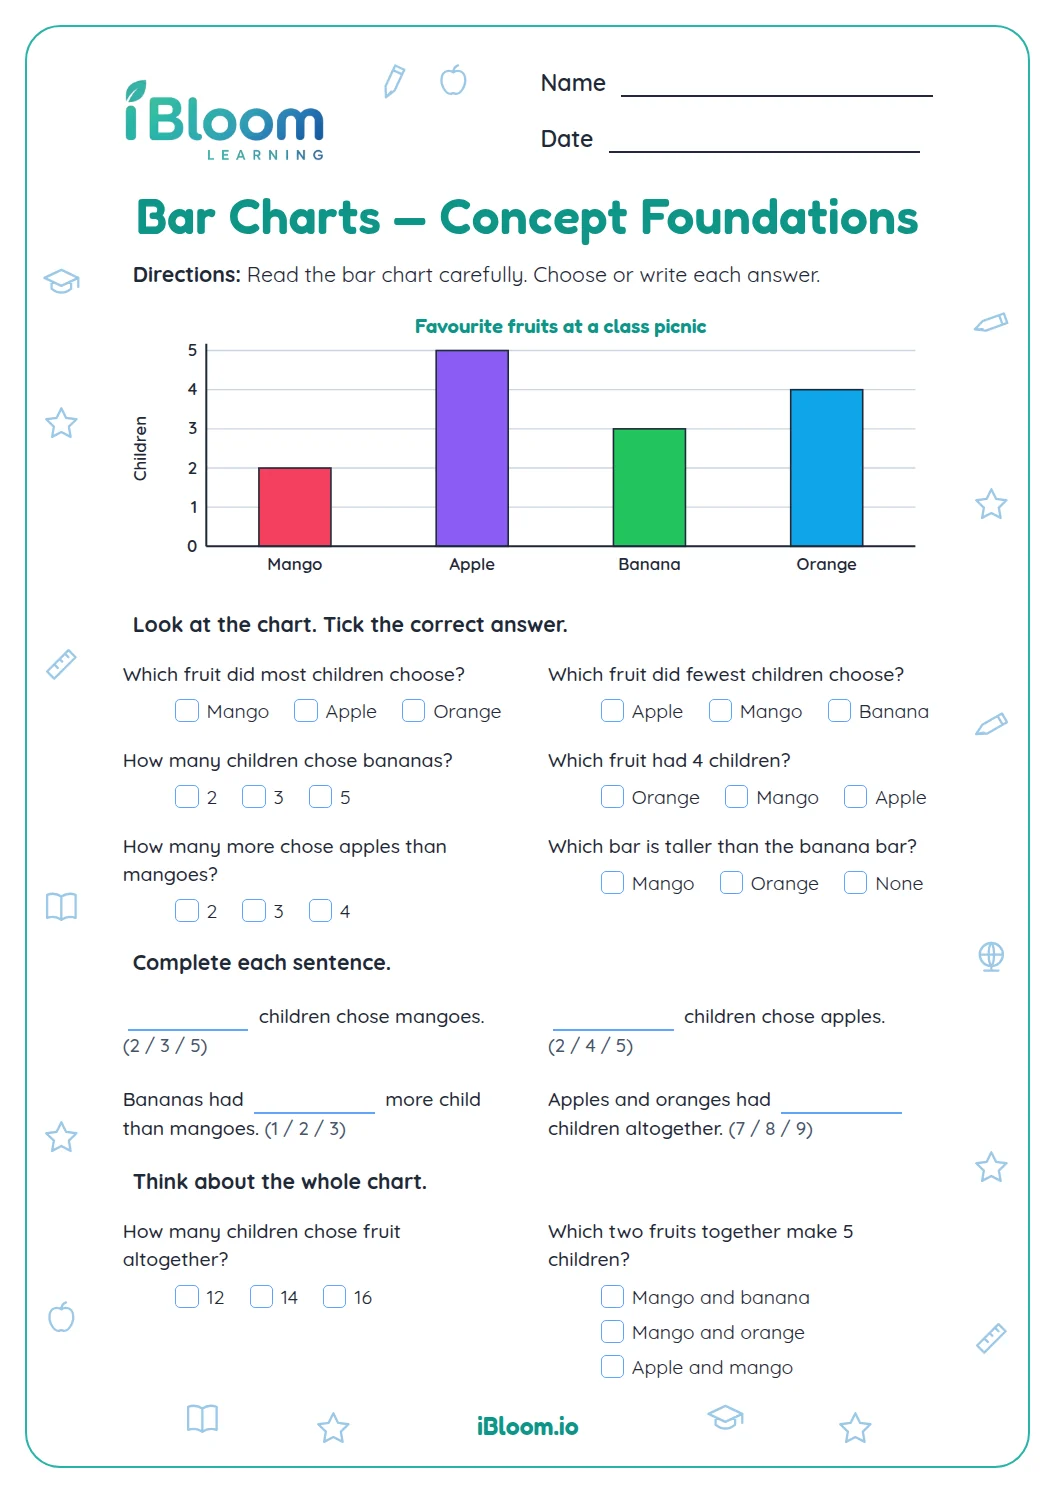 Bar Charts — Concept FoundationsConcept Foundations for bar charts in Grade 2. Read one simple bar chart, then identify values, compare bars, and answer data questions.Grade 2Free PDF preview
 Bar Graphs — Concept FoundationsConcept Foundations for bar graphs in Grade 2. Read the bar graph, identify values, compare bars, and solve simple questions about the data.Grade 2Free PDF preview
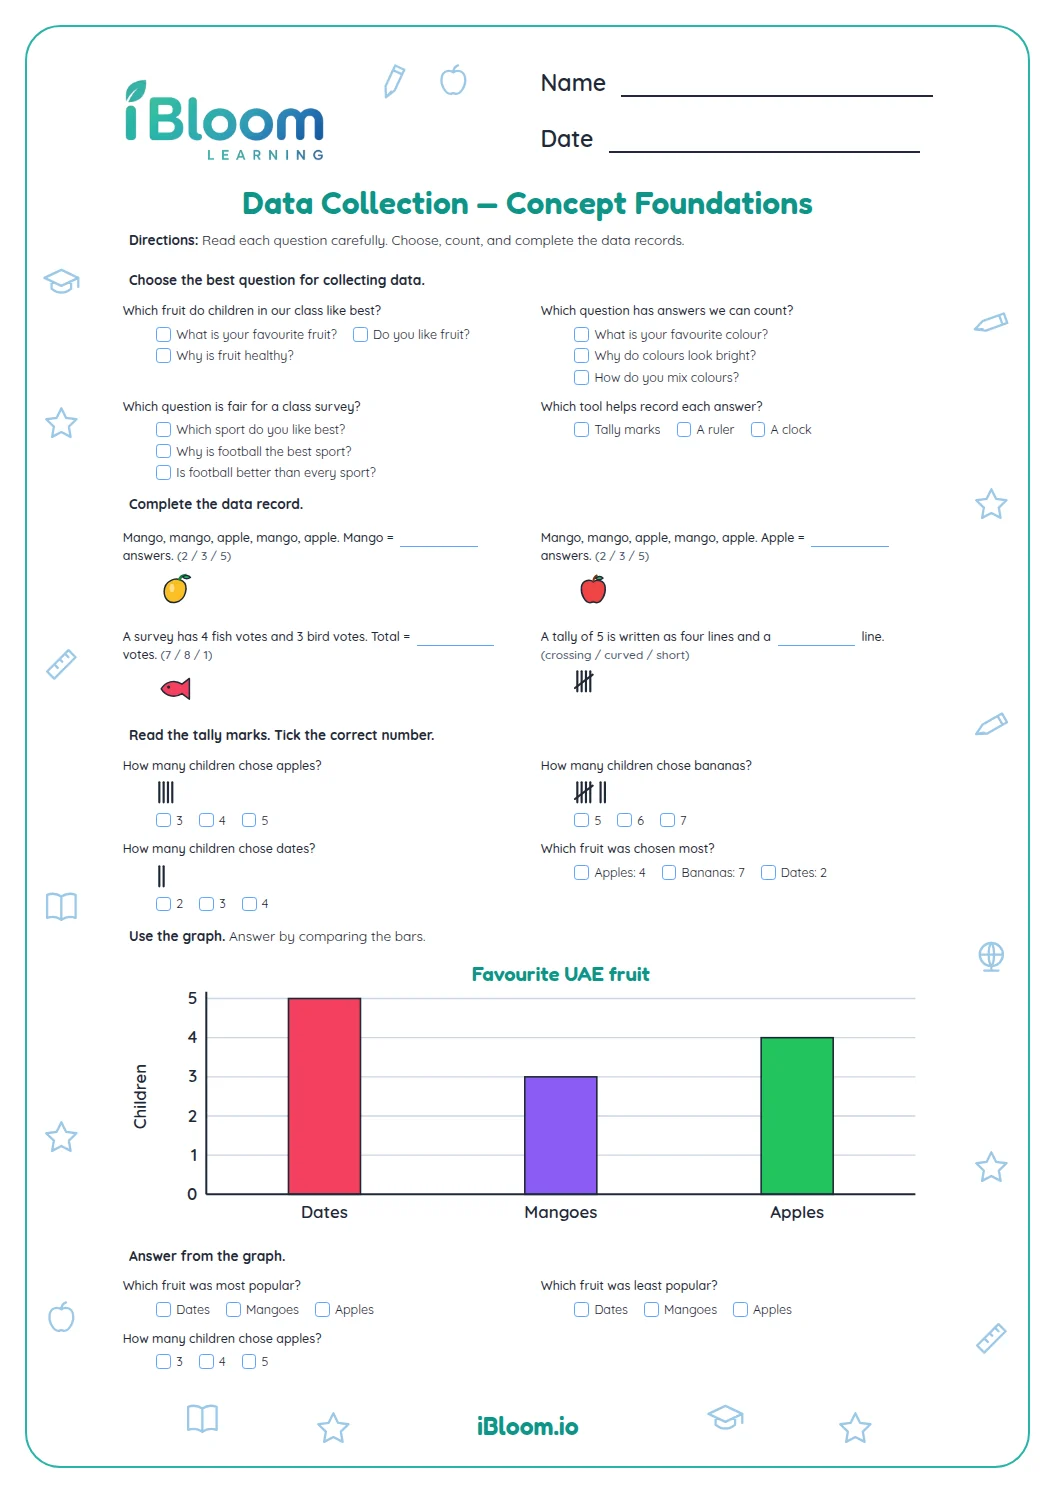 Data Collection — Concept FoundationsConcept Foundations for data collection in Grade 2. Identify fair survey questions, record answers with tally marks, count totals, and read a simple bar graph.Grade 2Free PDF preview
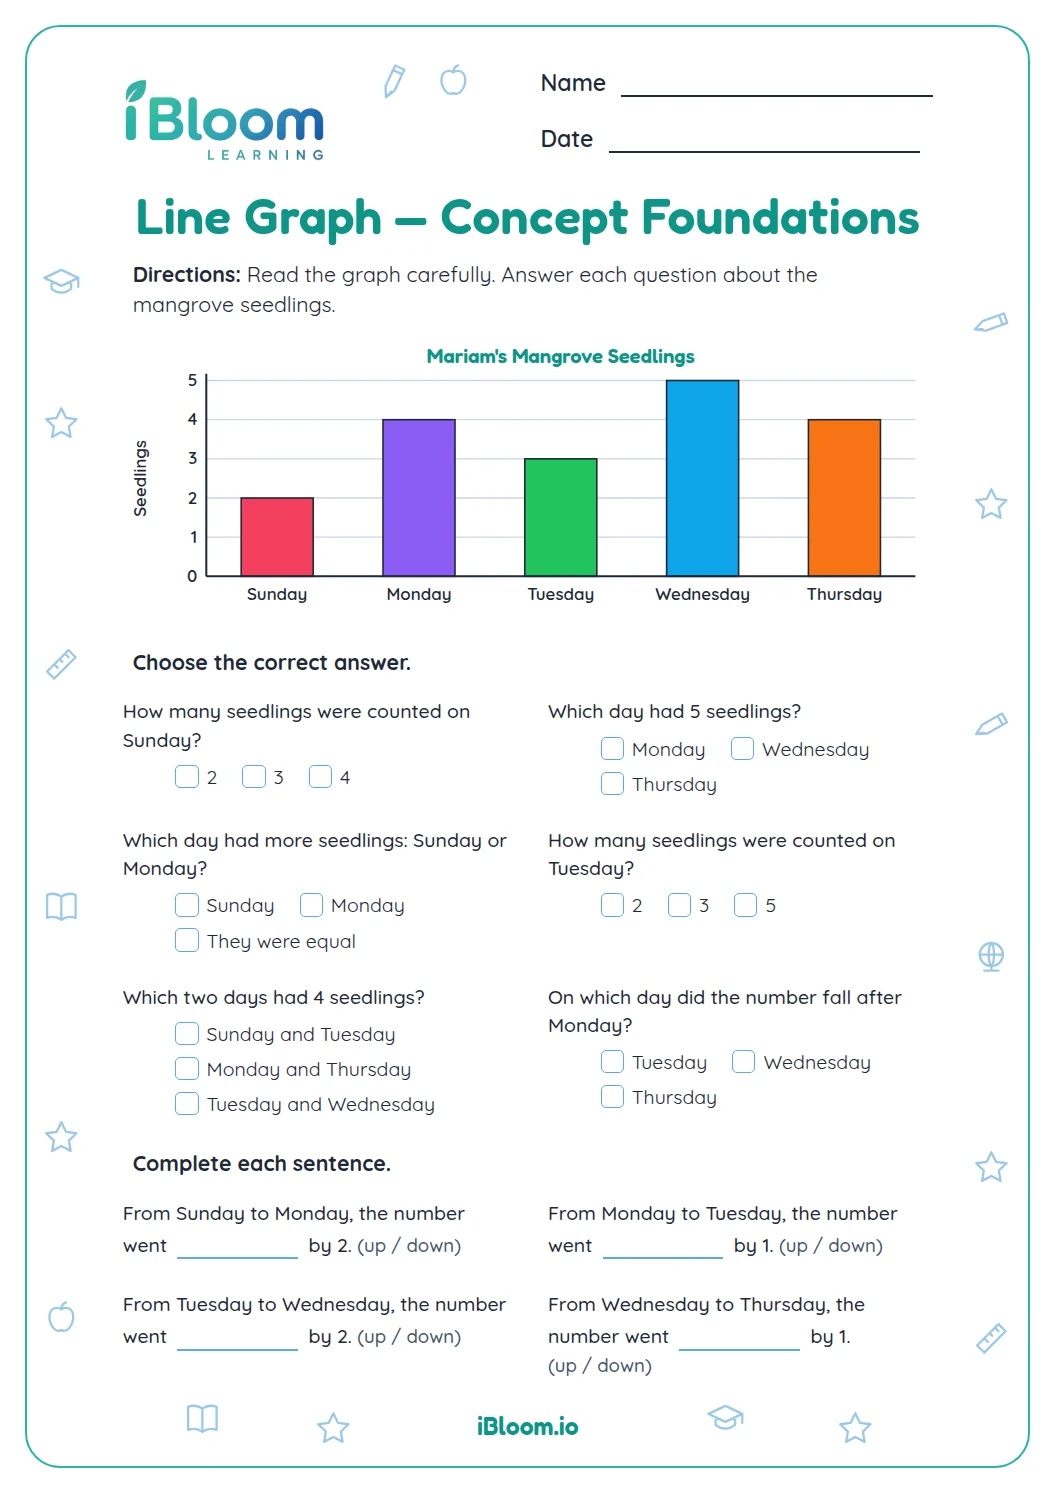 Line Graph — Concept FoundationsConcept Foundations for line graph in Grade 2. Read the displayed graph, find values, compare points, and describe simple changes using words and numbers.Grade 2Free PDF preview
 Line Plots — Concept FoundationsConcept Foundations for line plots in Grade 2. Read simple line plots, count X marks, and answer questions about totals and comparisons.Grade 2Free PDF preview
 Making Pie Charts — Concept FoundationsConcept Foundations for making pie charts in Grade 2. Identify the whole, count equal parts, and decide how many parts to colour for halves, quarters, and eighths.Grade 2Free PDF preview
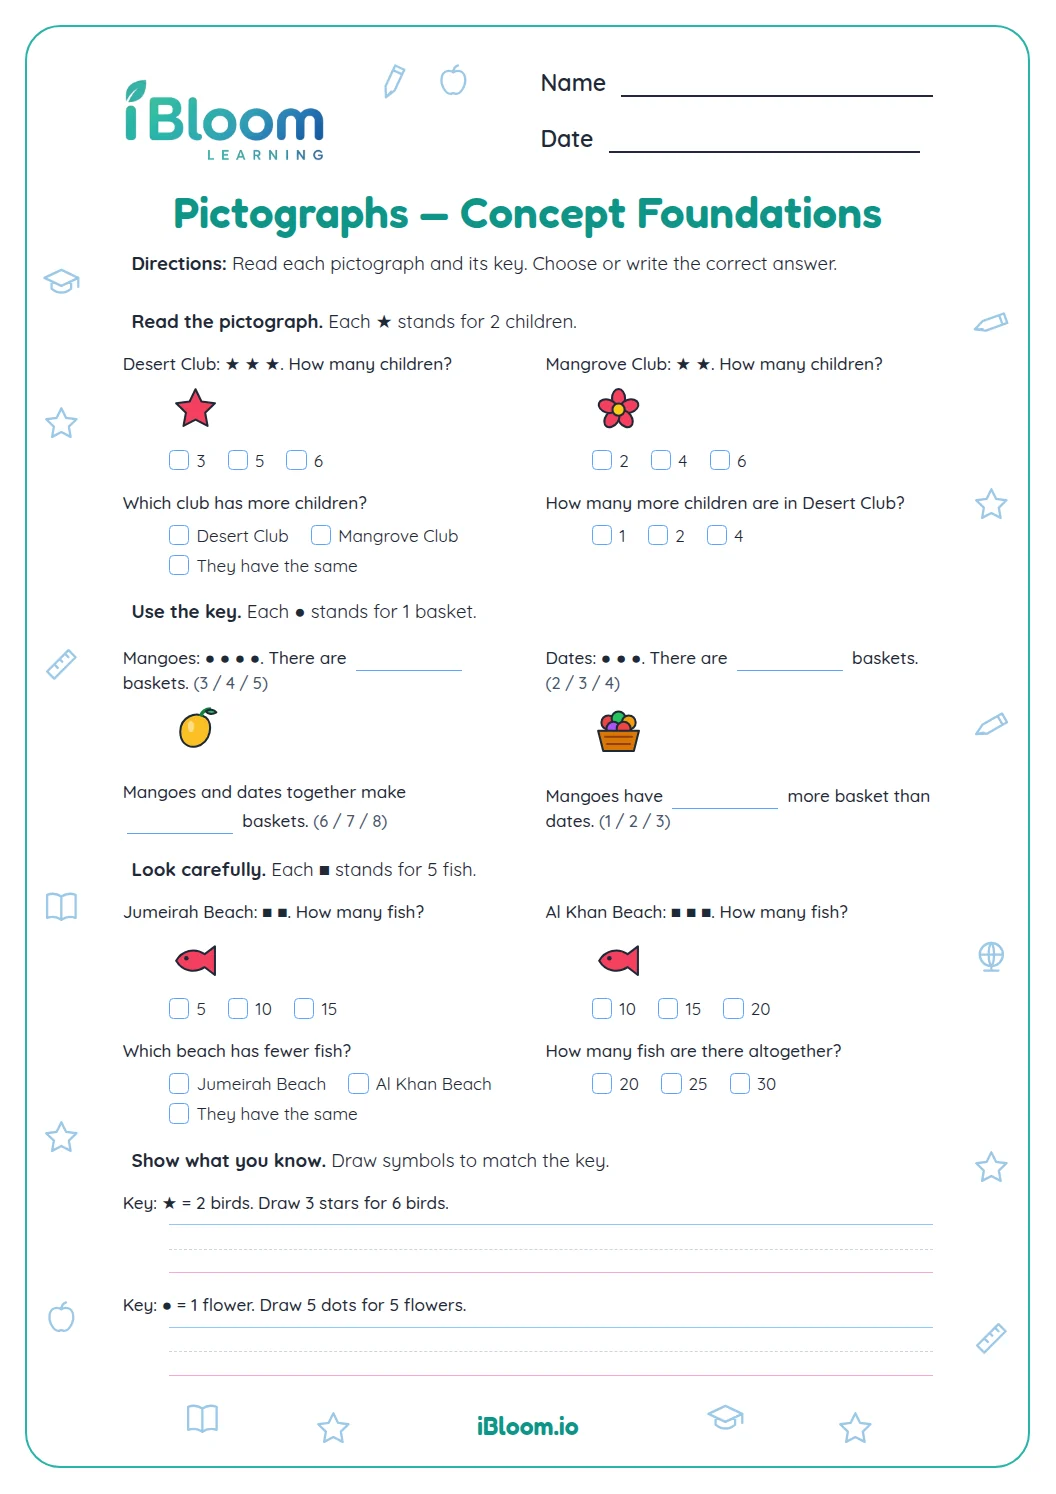 Pictographs — Concept FoundationsConcept Foundations for pictographs in Grade 2. Read short pictographs, use each key, compare categories, and answer questions about the data.Grade 2Free PDF preview
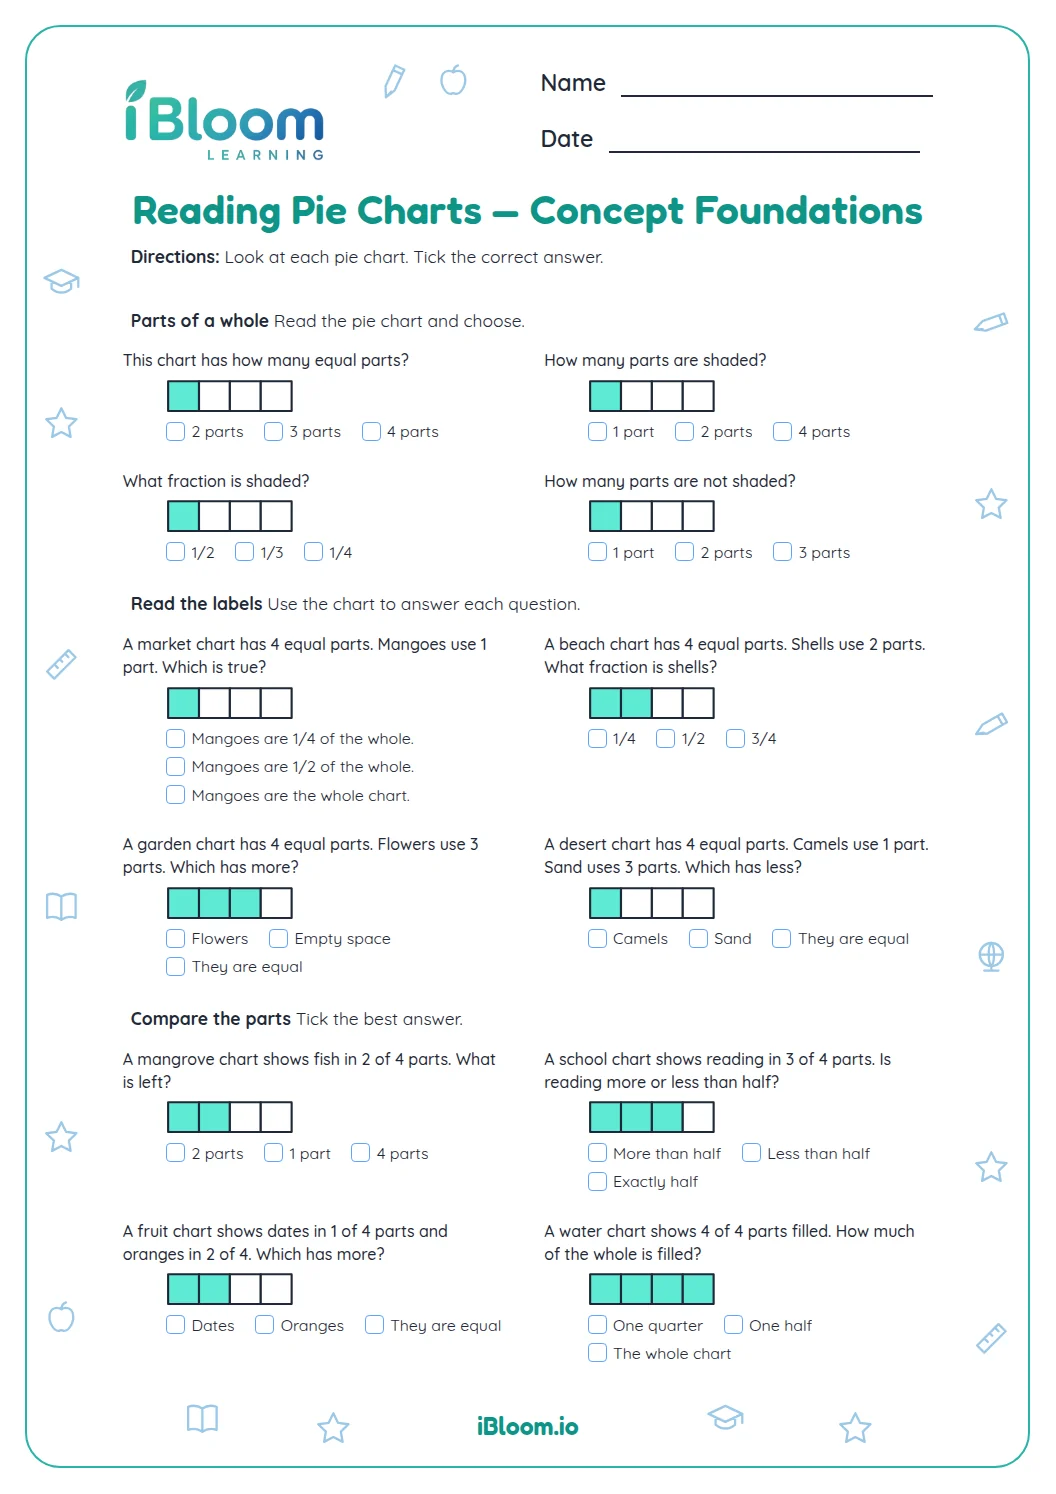 Reading Pie Charts — Concept FoundationsConcept Foundations for reading pie charts in Grade 2. Look at simple pie-chart parts, identify equal parts, compare categories, and answer questions about the whole.Grade 2Free PDF preview
 Sort Count — Concept FoundationsConcept Foundations for sort count in Grade 2. Sort familiar items into groups, count each group, and answer simple questions about the totals.Grade 2Free PDF preview
 Tally Sheet — Concept FoundationsConcept Foundations for tally sheet in Grade 2. Read tally marks, count groups of five, and choose or write the matching totals.Grade 2Free PDF preview
 Venn Diagrams — Concept FoundationsConcept Foundations for venn diagrams in Grade 2. Sort each object into one Venn-diagram region: Circle A, Circle B, both circles, or neither.Grade 2Free PDF preview
 Bar Charts — Visual ModelsVisual Models for bar charts in Grade 2. Read the bar chart, compare bar lengths, and answer questions about the data.Grade 2Free PDF preview
 Bar Graphs — Visual ModelsVisual Models for bar graphs in Grade 2. Read the bar graph, use its visual heights to compare amounts, and answer questions about the data.Grade 2Free PDF preview
 Data Collection — Visual ModelsVisual Models for data collection in Grade 2. Read tally marks and a bar graph to collect, compare, and describe data.Grade 2Free PDF preview
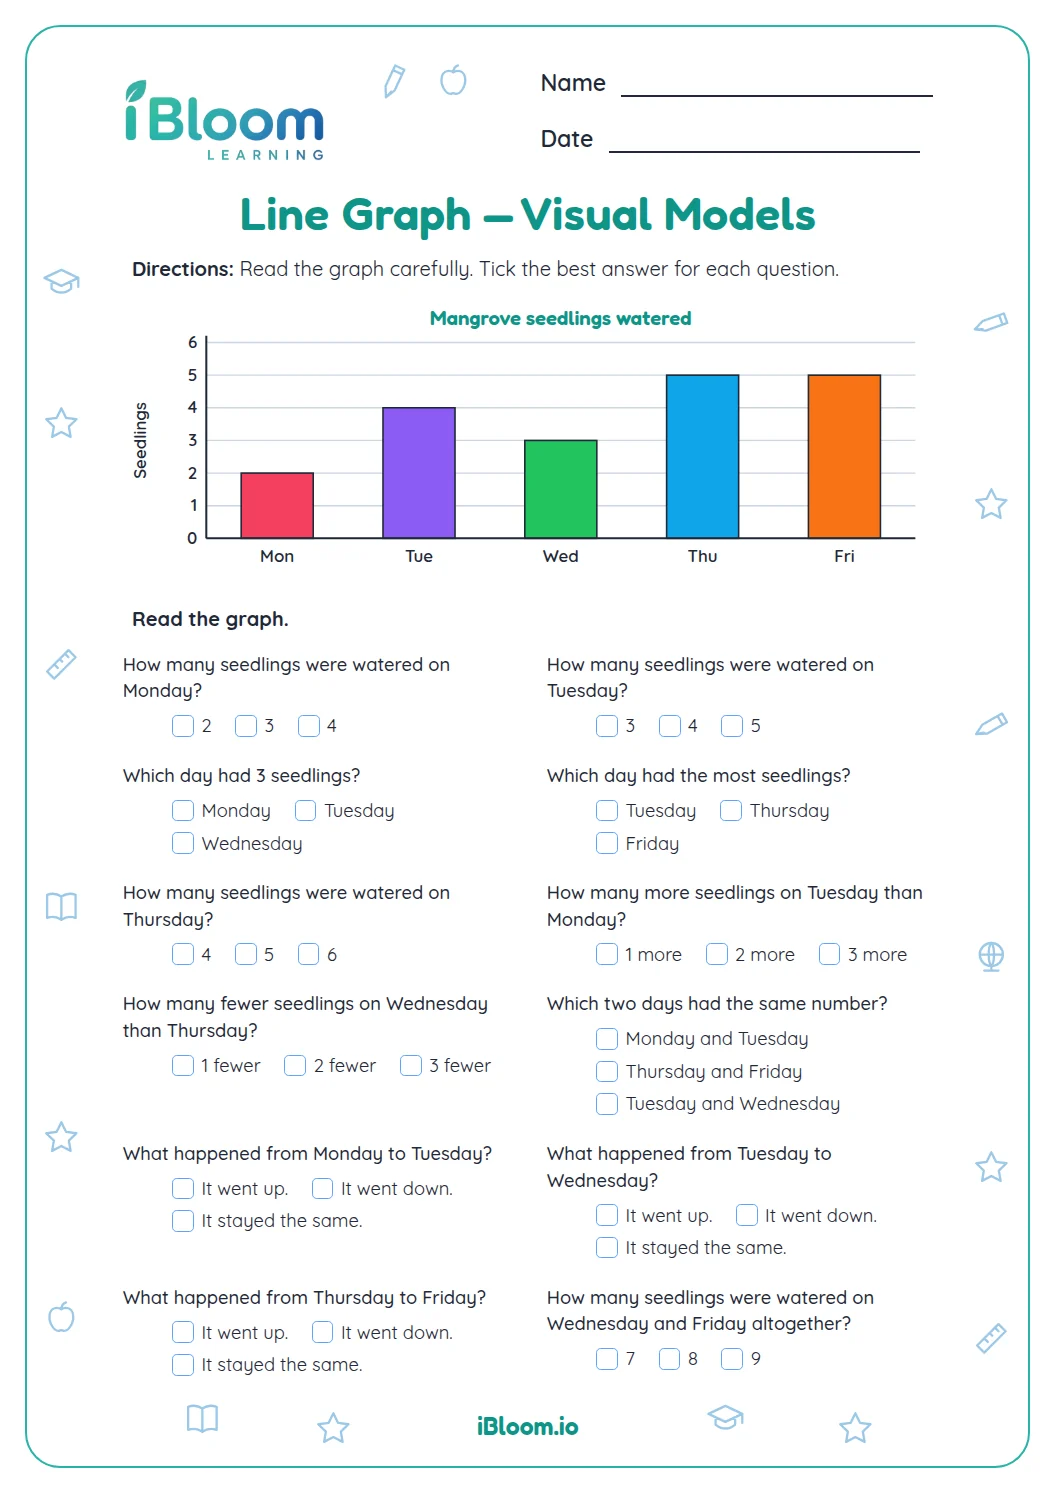 Line Graph — Visual ModelsVisual Models for line graph in Grade 2. Read a simple mangrove-growth graph, then compare values and describe changes using the visual model.Grade 2Free PDF preview
 Line Plots — Visual ModelsVisual Models for line plots in Grade 2. Read simple line plots with X marks, find totals and compare groups using visual models.Grade 2Free PDF preview
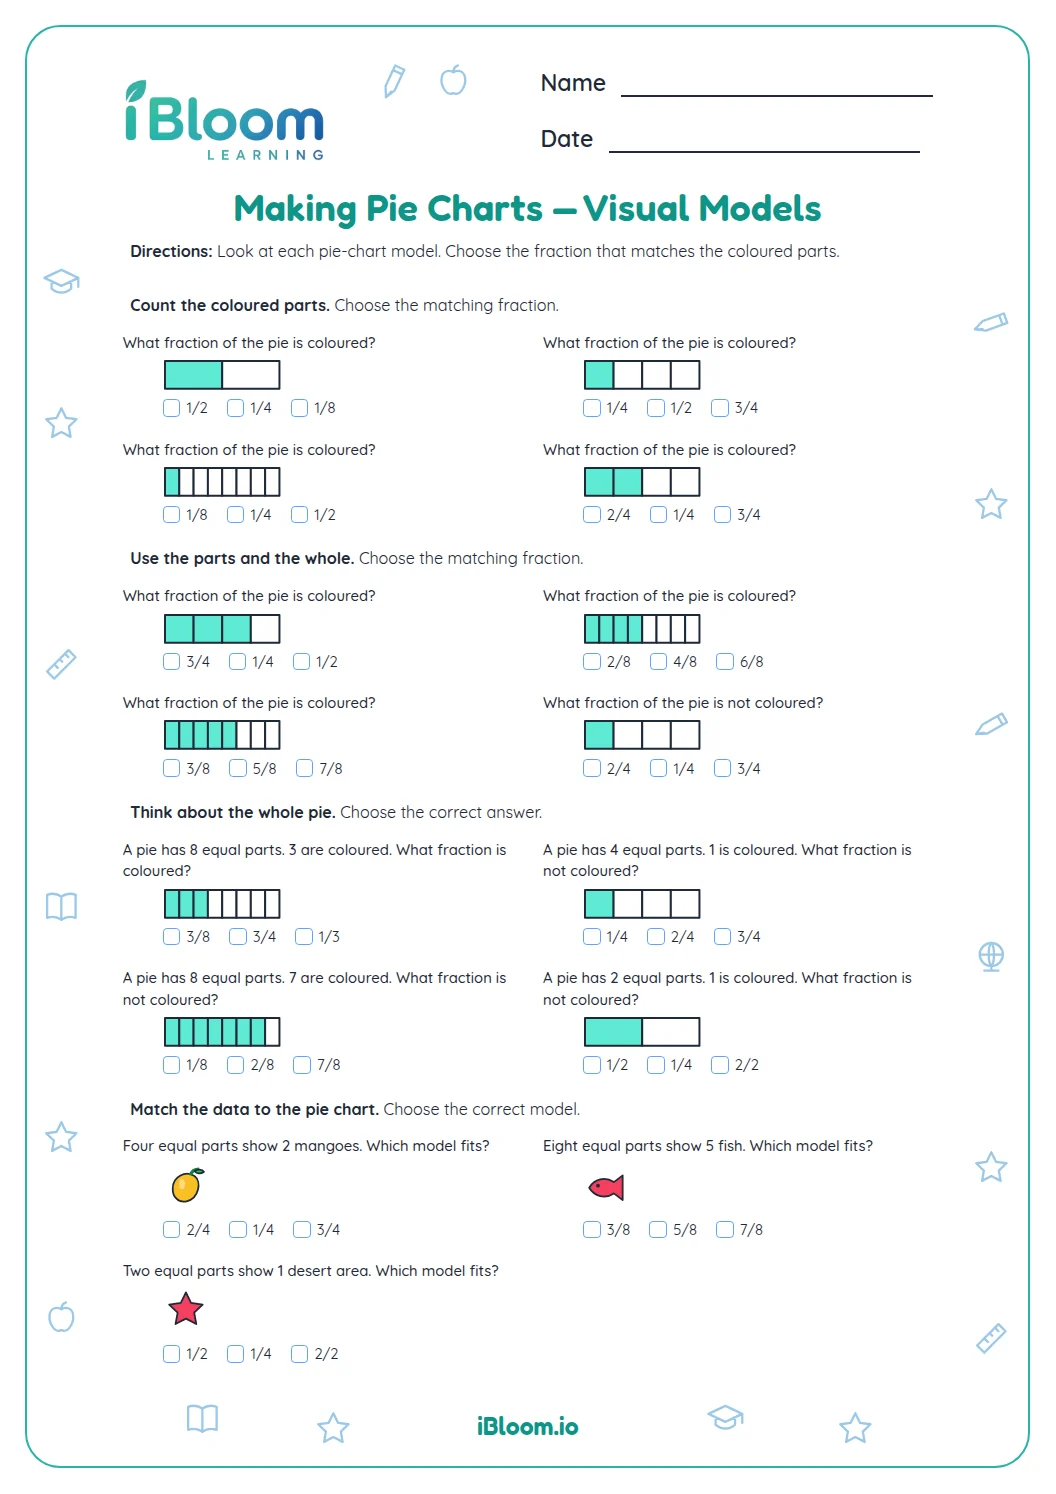 Making Pie Charts — Visual ModelsVisual Models for making pie charts in Grade 2. Look at simple pie-chart models, count equal parts, and choose the fraction each model shows.Grade 2Free PDF preview
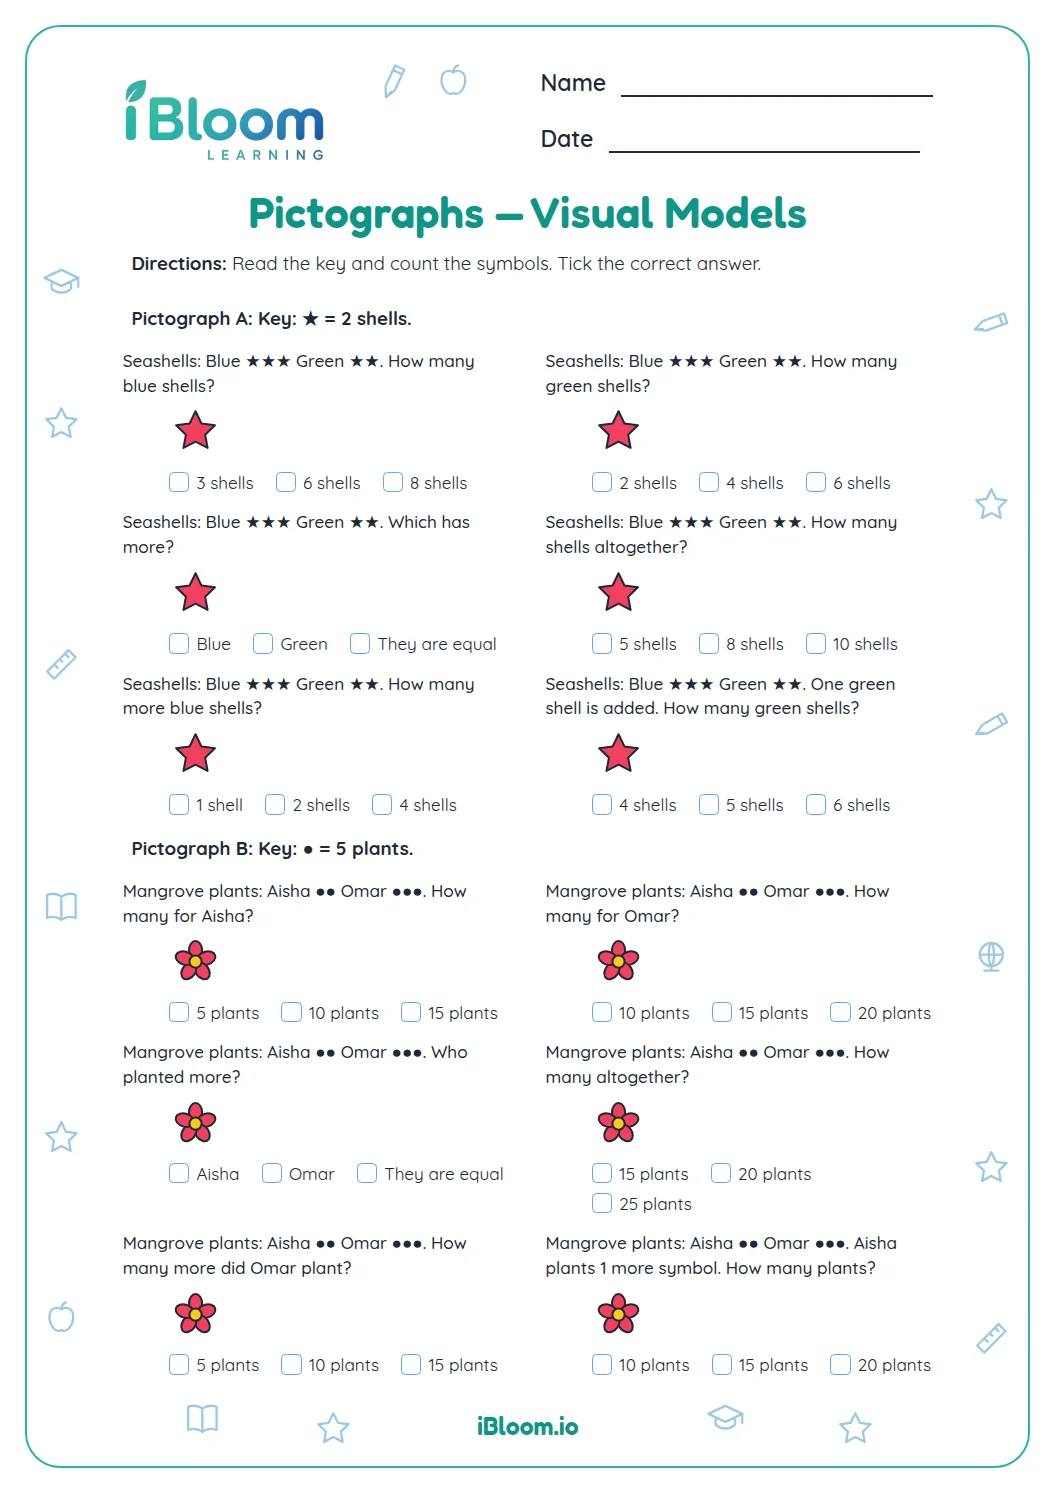 Pictographs — Visual ModelsVisual Models for pictographs in Grade 2. Read each pictograph key, count the symbols, and compare categories to answer questions.Grade 2Free PDF preview
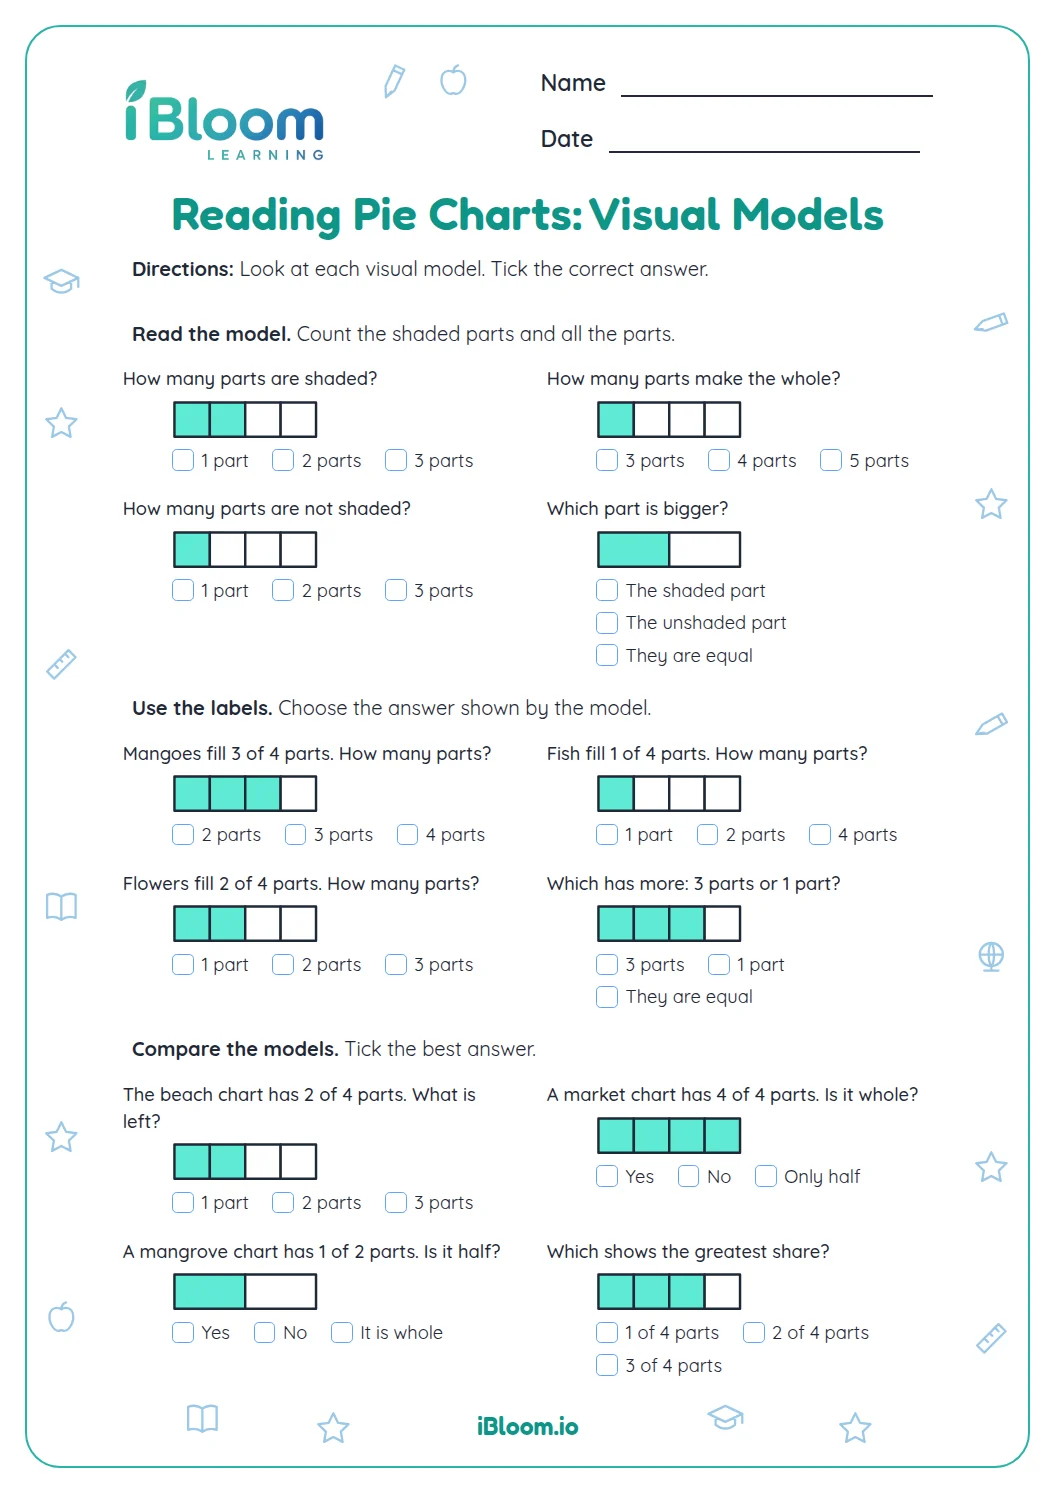 Reading Pie Charts — Visual ModelsVisual Models for reading pie charts in Grade 2. Read each visual model, identify the number of equal parts, and compare categories in simple pie-chart questions.Grade 2Free PDF preview
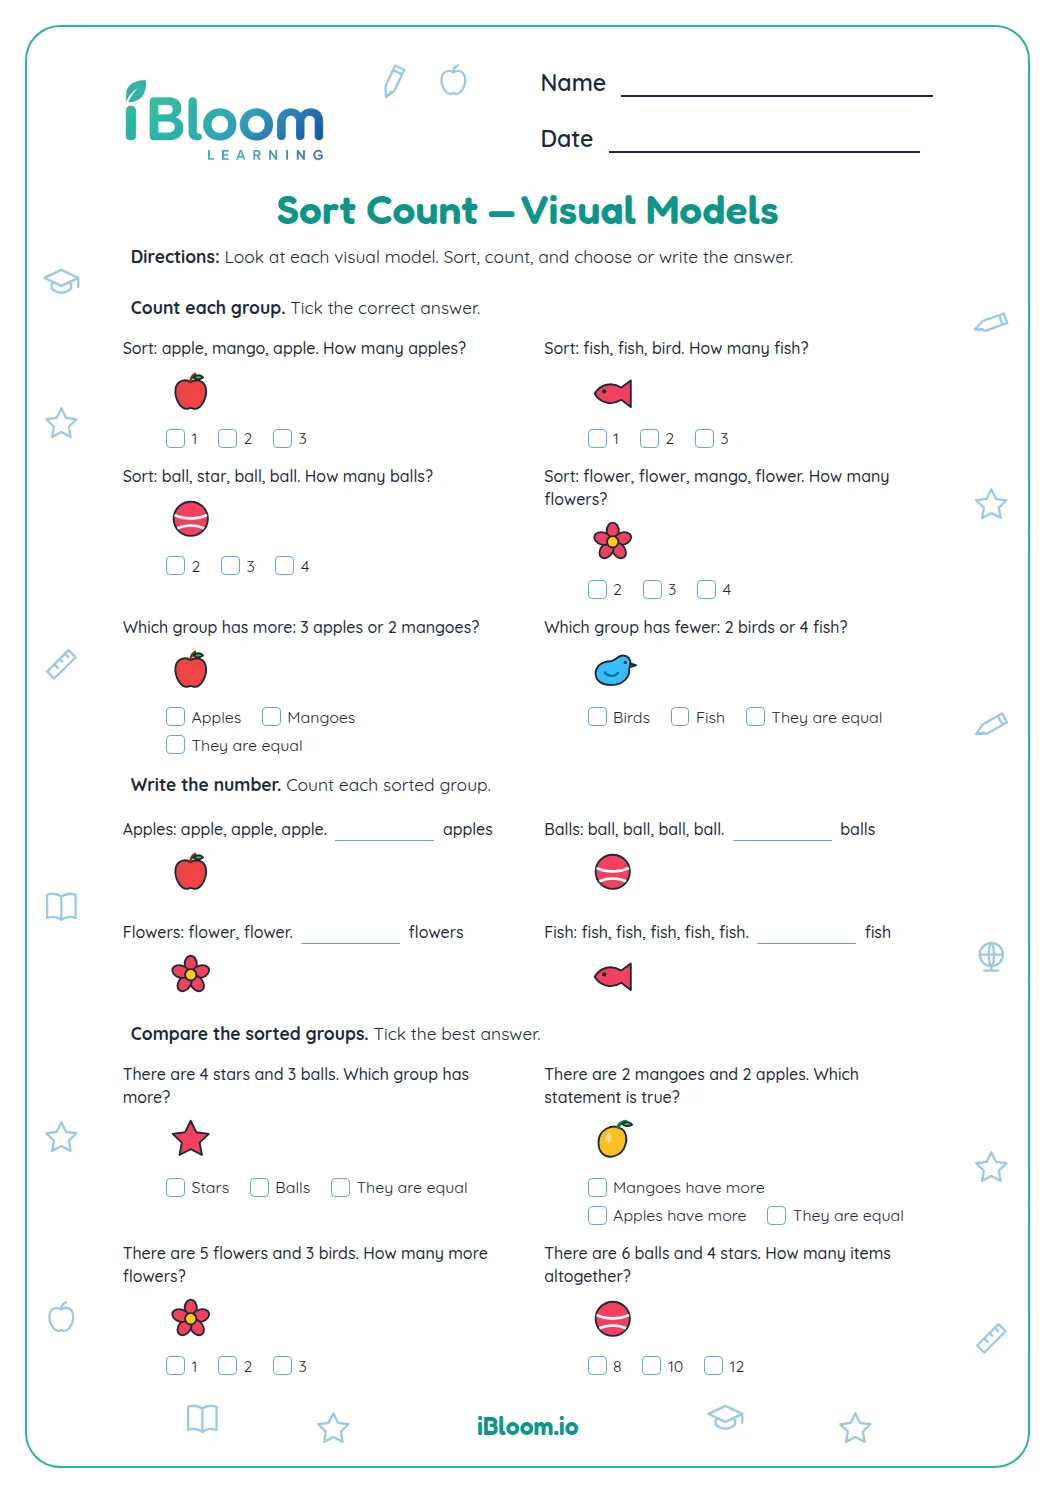 Sort Count — Visual ModelsVisual Models for sort count in Grade 2. Sort pictured items into groups, count each group, and answer simple visual comparison questions.Grade 2Free PDF preview
Practice that builds confidence
Practise Data Graphing
Explore data graphing practice activities within Grade 2 Math Practice, organised so children, families, and elementary teachers can move from broad learning areas to focused printable practice.
Explore data graphing practice activities within Grade 2 Math Practice, organised so children, families, and elementary teachers can move from broad learning areas to focused printable practice.
Explore printable data graphing worksheets for UAE learners. Choose a focused activity that suits the child's stage, model the first example together, and discuss how the child found the answer.

Using a worksheet well
Begin with a short explanation and one worked example. Let the child complete a manageable section, then ask them to explain their answer or show another method. For younger learners, pair the page with real objects, pictures, talk and play. If an item is difficult, return to the prerequisite skill and try again later.
Helpful answers
Frequently asked questions
How should I use these worksheets?
Choose a page that matches the current skill, model one example, and discuss the answers together.
Can I print a worksheet?
Yes. Open a published activity to preview its full printable page before printing.