Free printable practice
Data Graphing Practice Activities
Grade 3 students practise collecting, displaying, labelling, and interpreting data with line plots, pictographs, bar graphs, Venn diagrams, and more.
Explore Data Graphing
Free printable worksheet PDFs
Preview every available page, then download the free worksheet PDF for home, homeschool, tutoring, or classroom practice.
Preview the exact activity before downloading it.
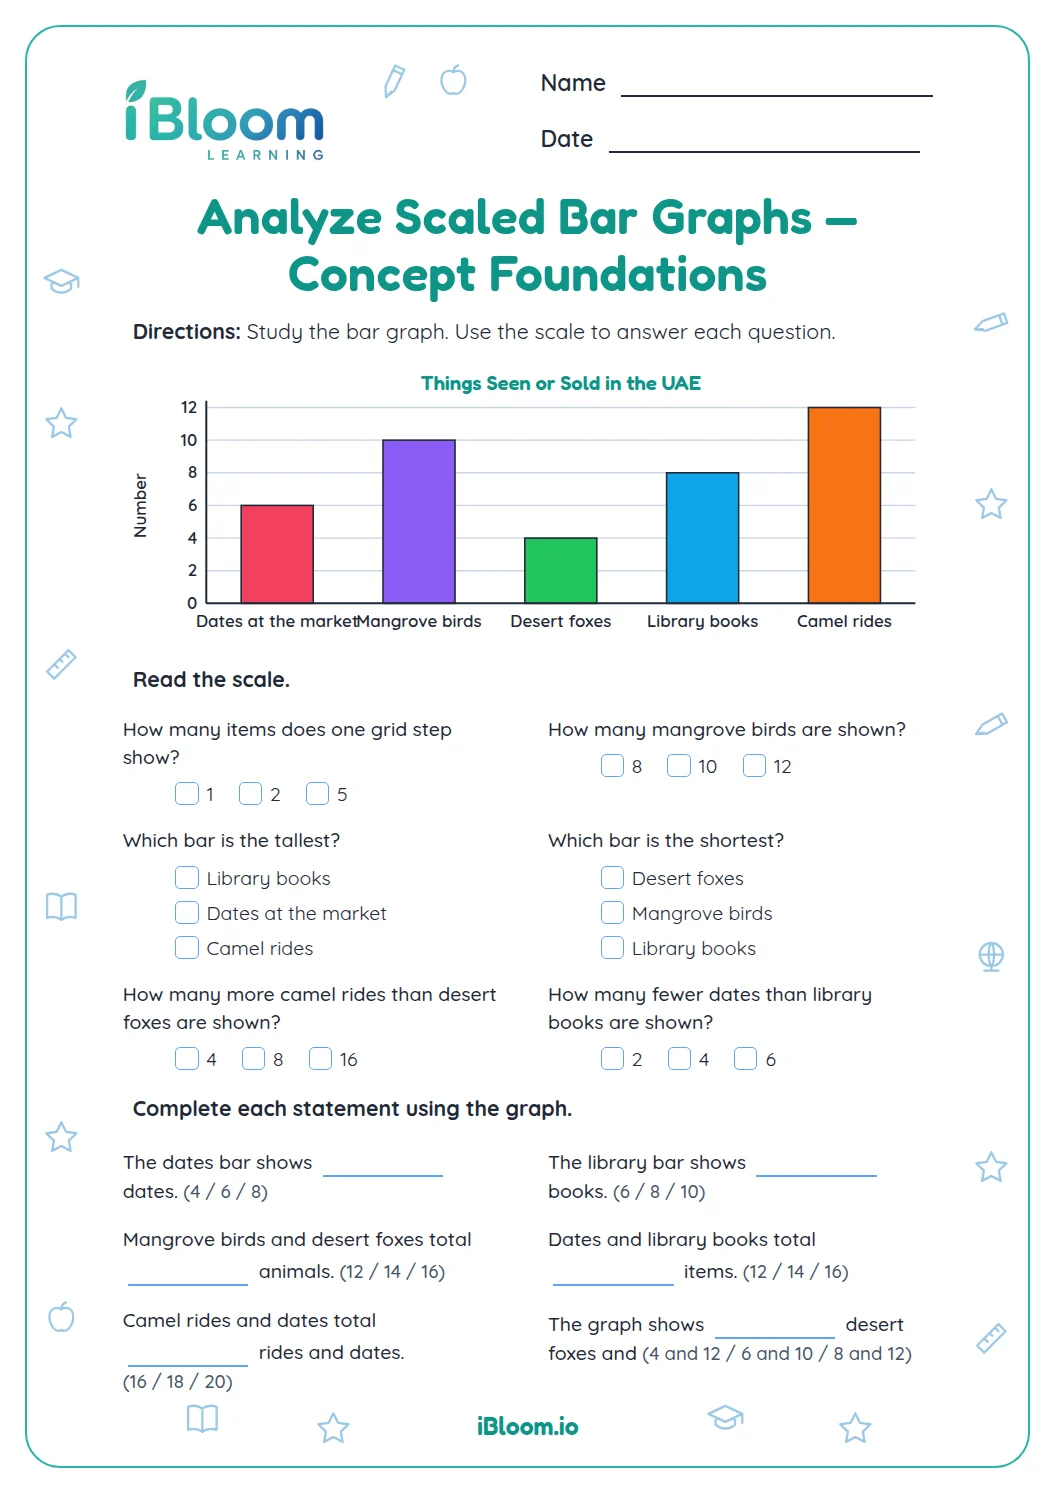 Analyze Scaled Bar Graphs — Concept FoundationsConcept Foundations for analyze scaled bar graphs in Grade 3. Read the scaled bar graph, use its scale to identify values, compare bars, find differences and totals, and answer data questions.Grade 3Free PDF preview
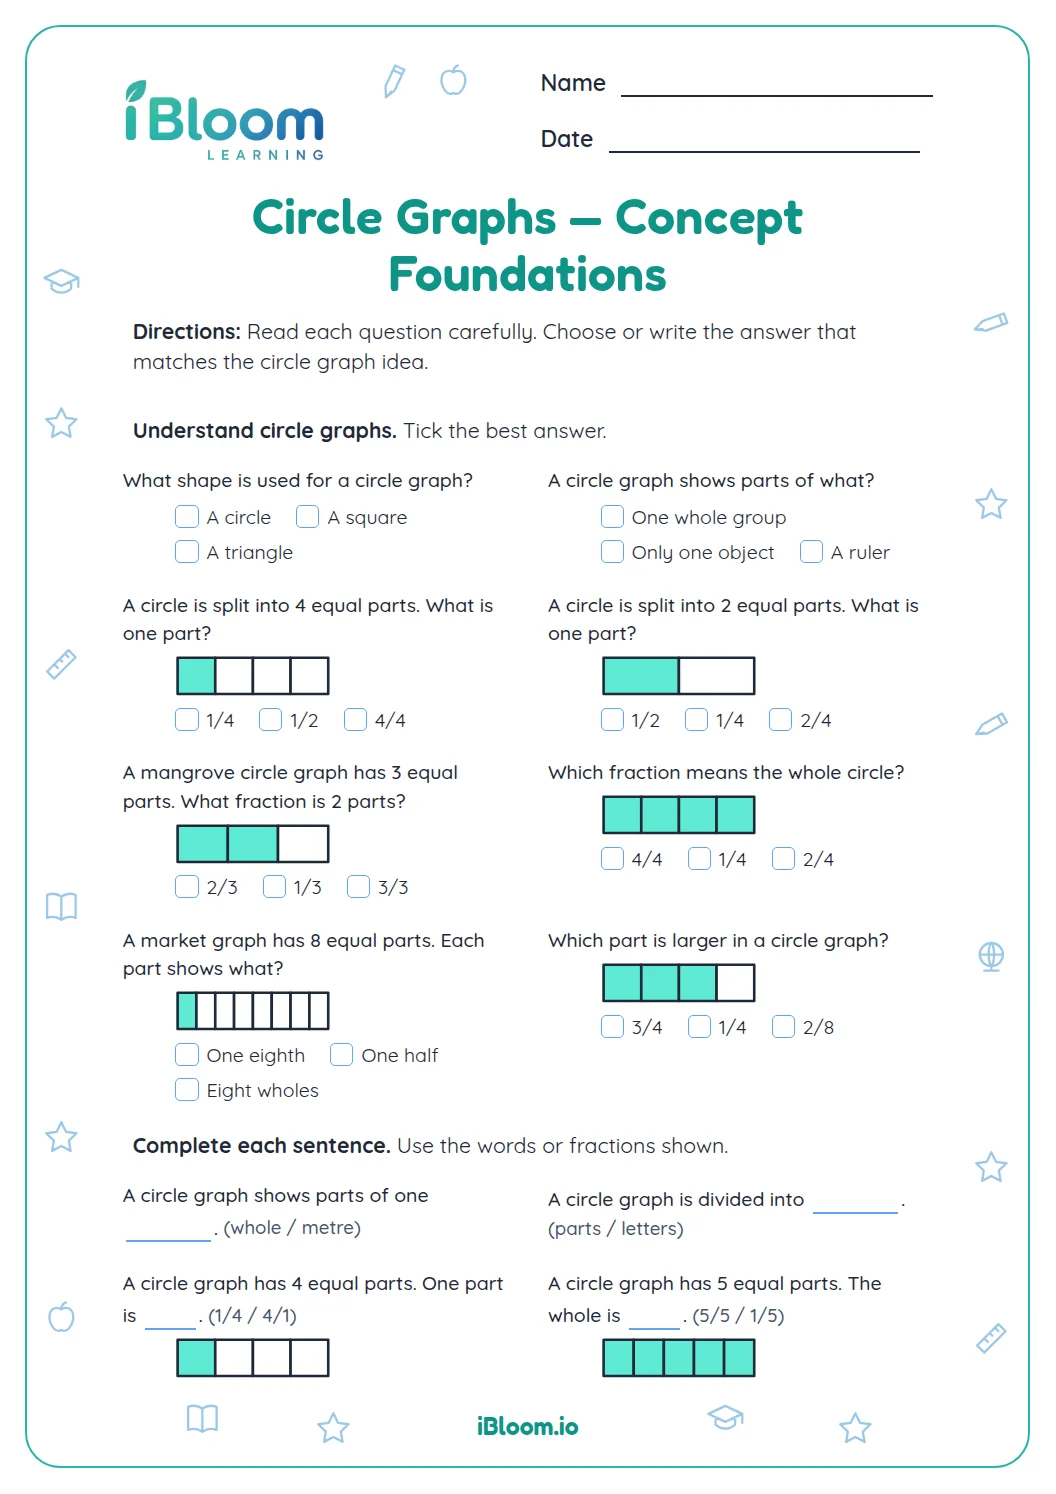 Circle Graphs — Concept FoundationsConcept Foundations for circle graphs in Grade 3. Read simple circle-graph information, identify equal parts and fractions, and choose or write the correct answer.Grade 3Free PDF preview
 Data Analysis — Concept FoundationsConcept Foundations for data analysis in Grade 3. Read the mangrove animal bar graph, compare bars, and use the data to answer questions.Grade 3Free PDF preview
 Data Collection — Concept FoundationsConcept Foundations for data collection in Grade 3. Identify a clear survey question, collect and organise responses using tally marks and frequency counts, then choose suitable data statements.Grade 3Free PDF preview
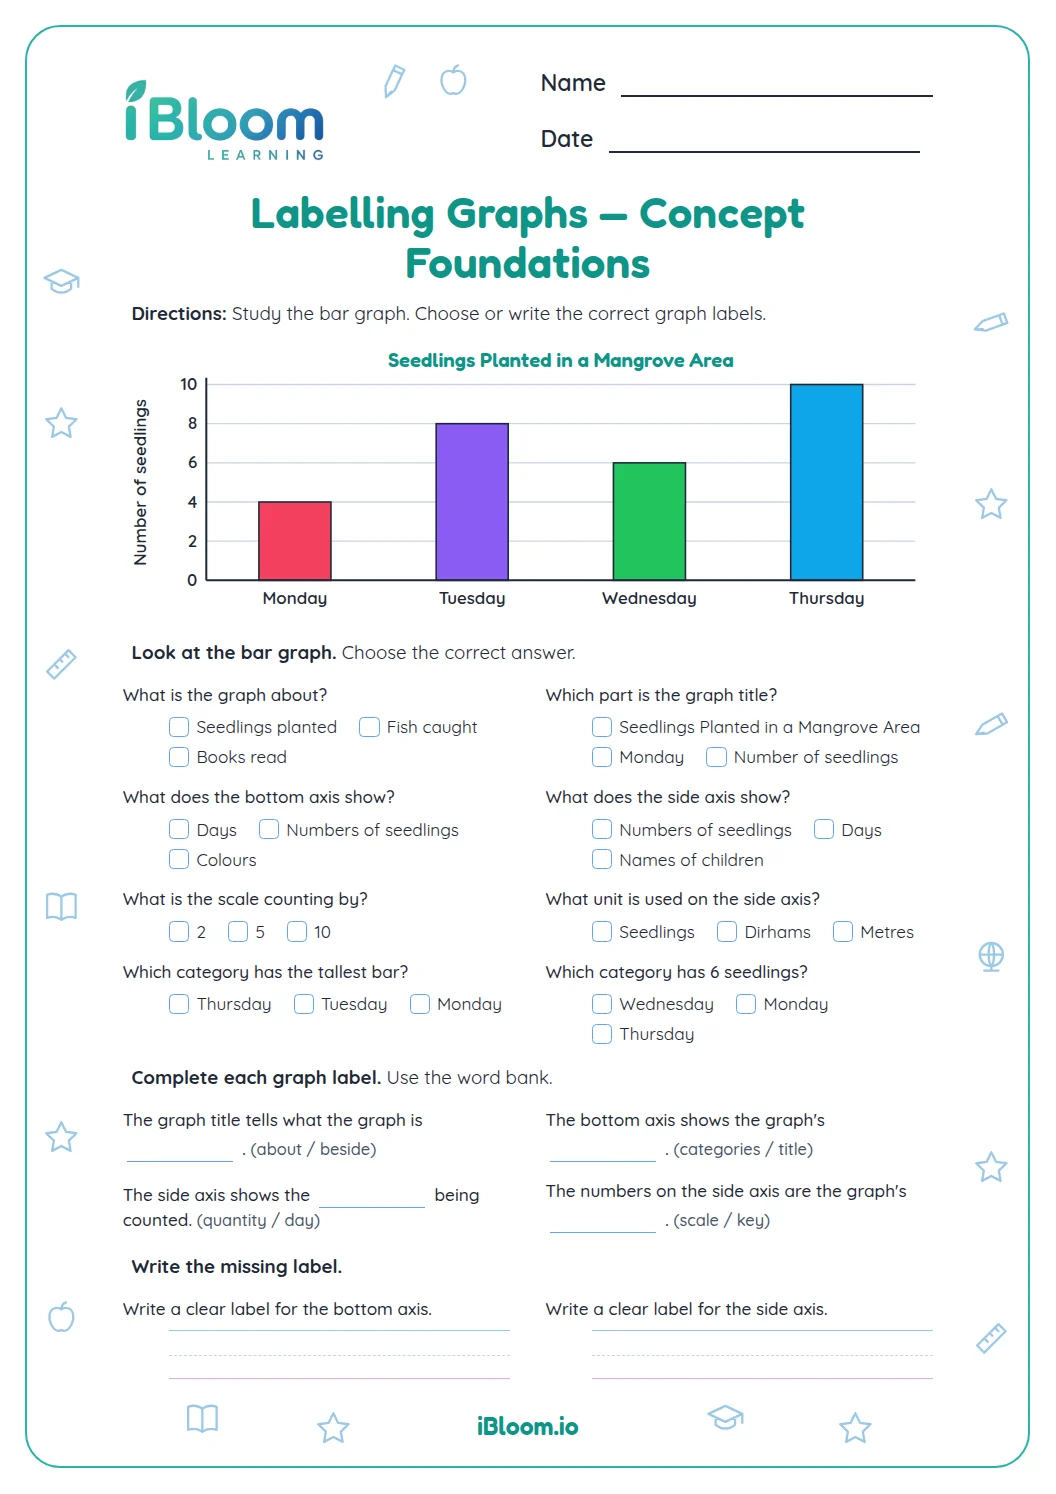 Labelling Graphs — Concept FoundationsConcept Foundations for labelling graphs in Grade 3. Study a simple bar graph, then choose and write its title, categories, scale, axis labels, and units.Grade 3Free PDF preview
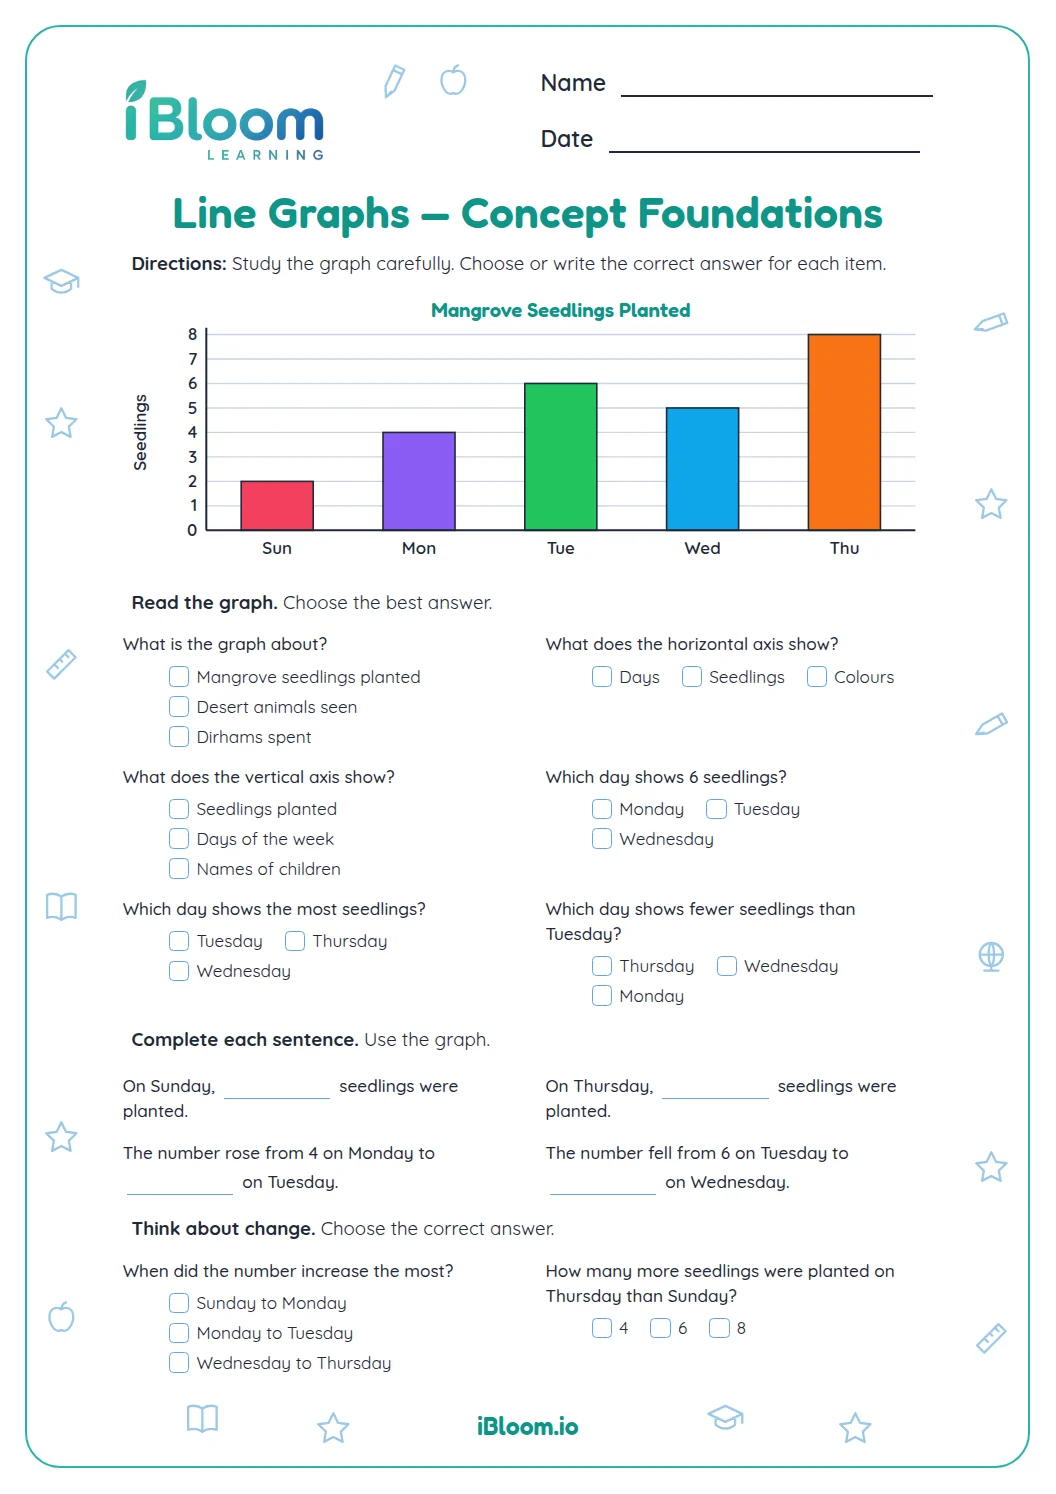 Line Graphs — Concept FoundationsConcept Foundations for line graphs in Grade 3. Read the graph, identify its title, axes, scale and points, then compare values and describe changes.Grade 3Free PDF preview
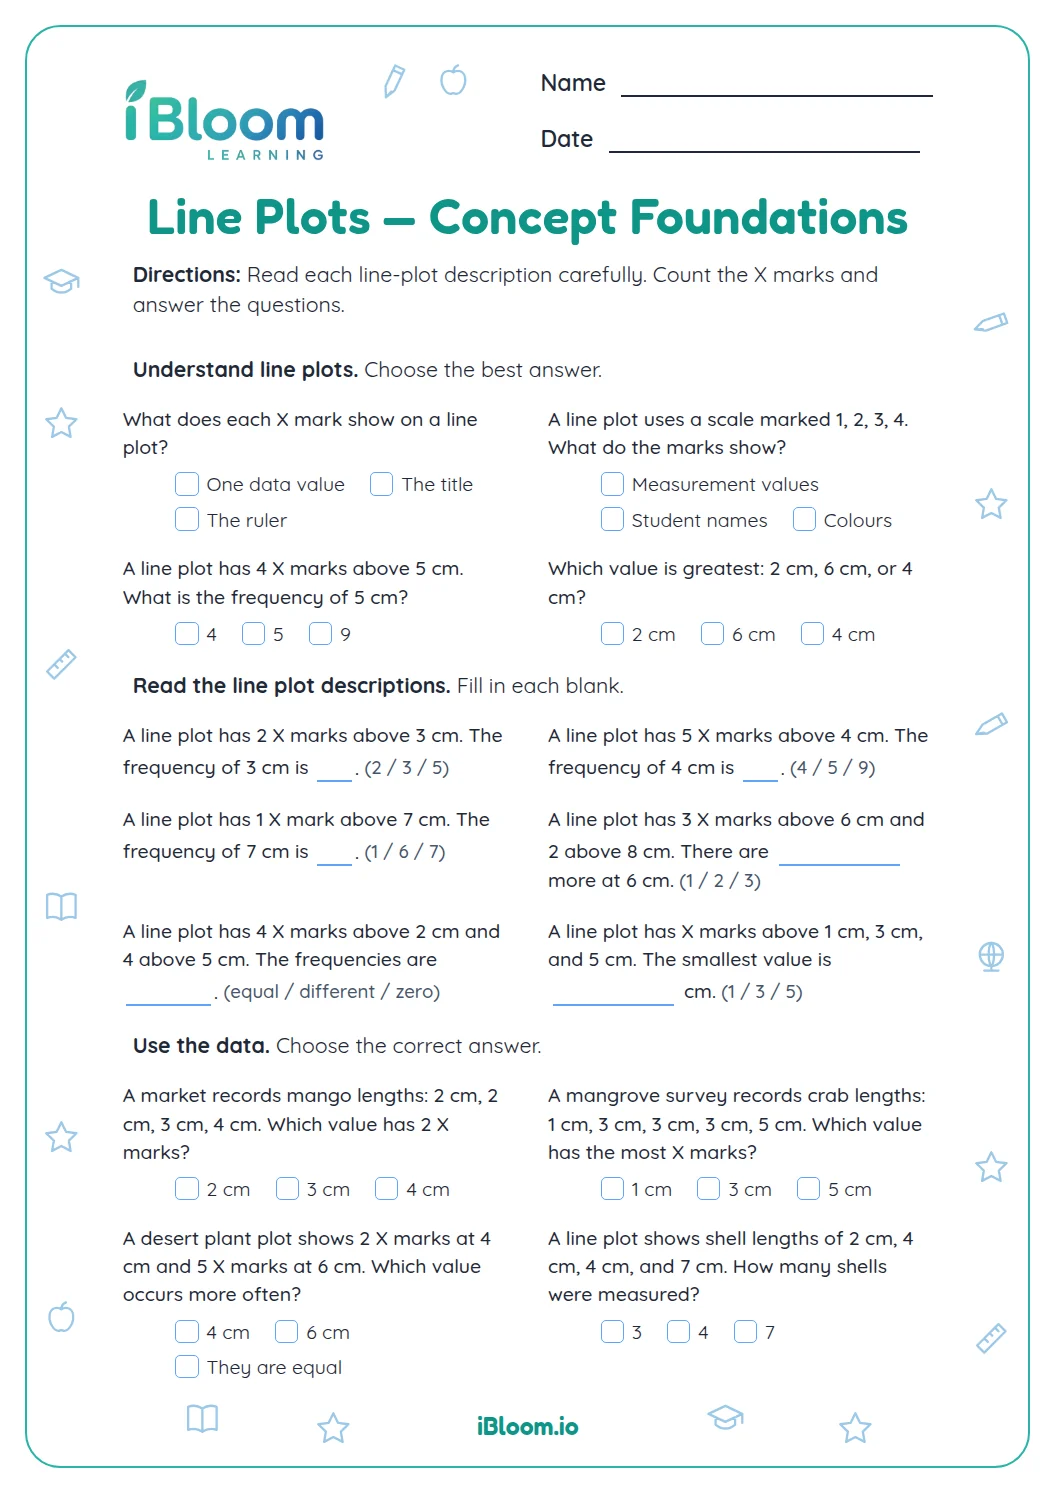 Line Plots — Concept FoundationsConcept Foundations for line plots in Grade 3. Read simple line-plot data, identify the measurement scale and X marks, then answer frequency and comparison questions.Grade 3Free PDF preview
 Line Plots Draw — Concept FoundationsConcept Foundations for line plots draw in Grade 3. Read small data sets, identify line-plot parts, and draw clear line plots with a title, scale, labels, and X marks.Grade 3Free PDF preview
 Scaled Bar Graphs — Concept FoundationsConcept Foundations for scaled bar graphs in Grade 3. Read a scaled bar graph, use its key to find totals and comparisons, and draw bars for given data.Grade 3Free PDF preview
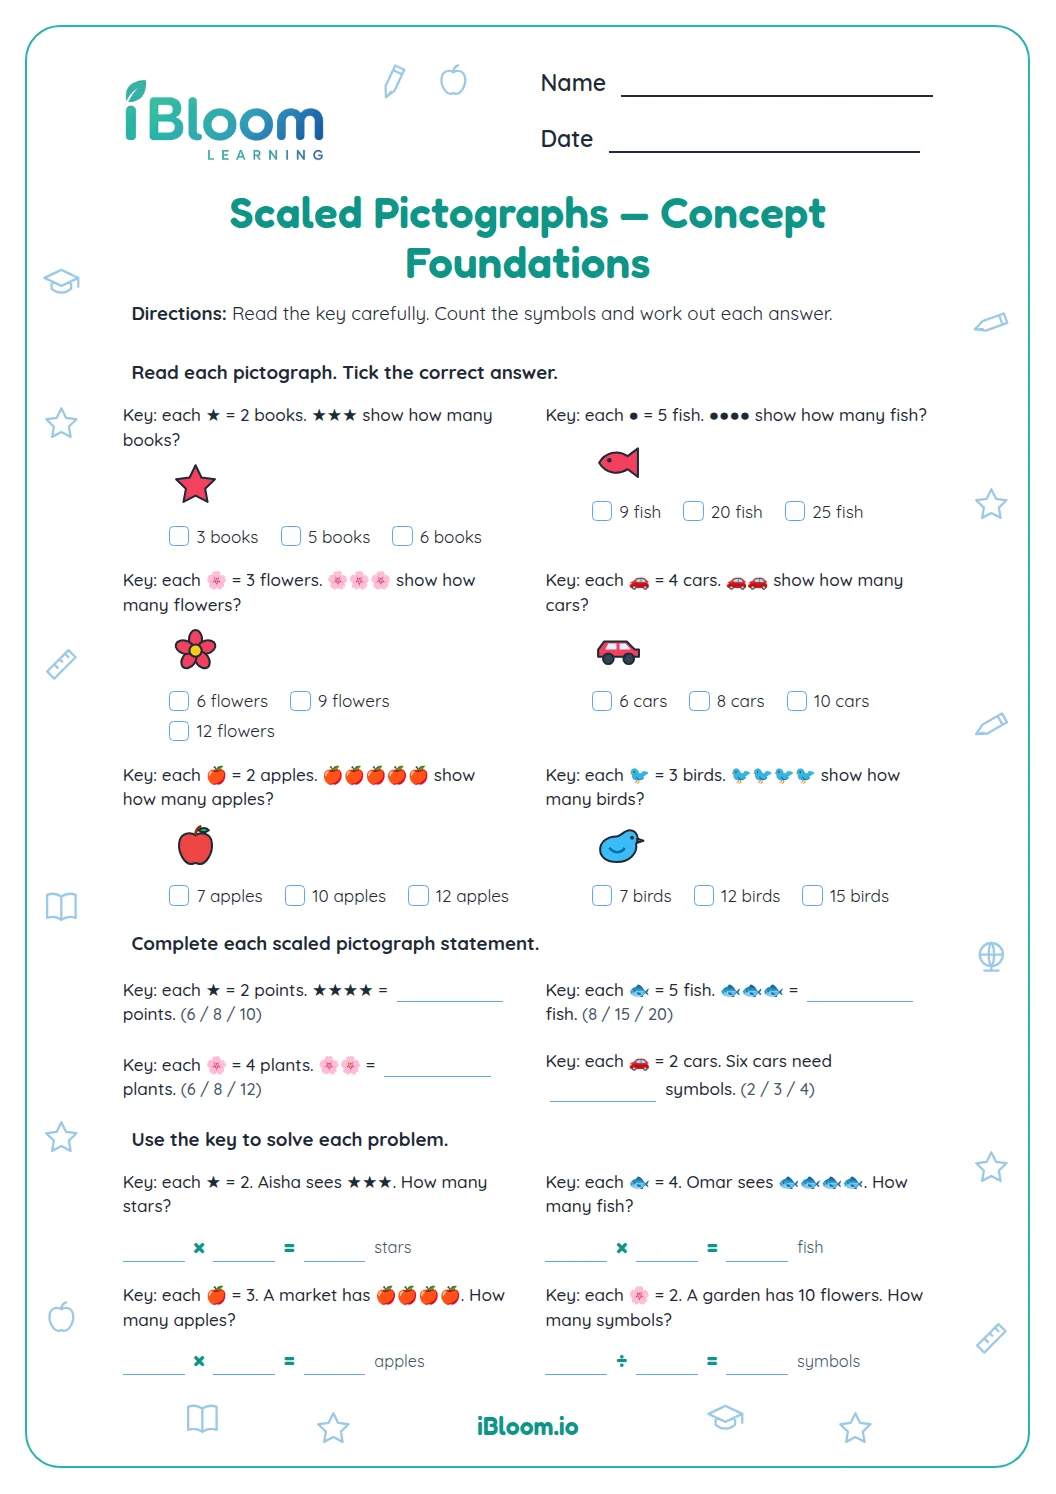 Scaled Pictographs — Concept FoundationsConcept Foundations for scaled pictographs in Grade 3. Read each key, count the picture symbols, and use the scale to find totals, differences, and missing symbols.Grade 3Free PDF preview
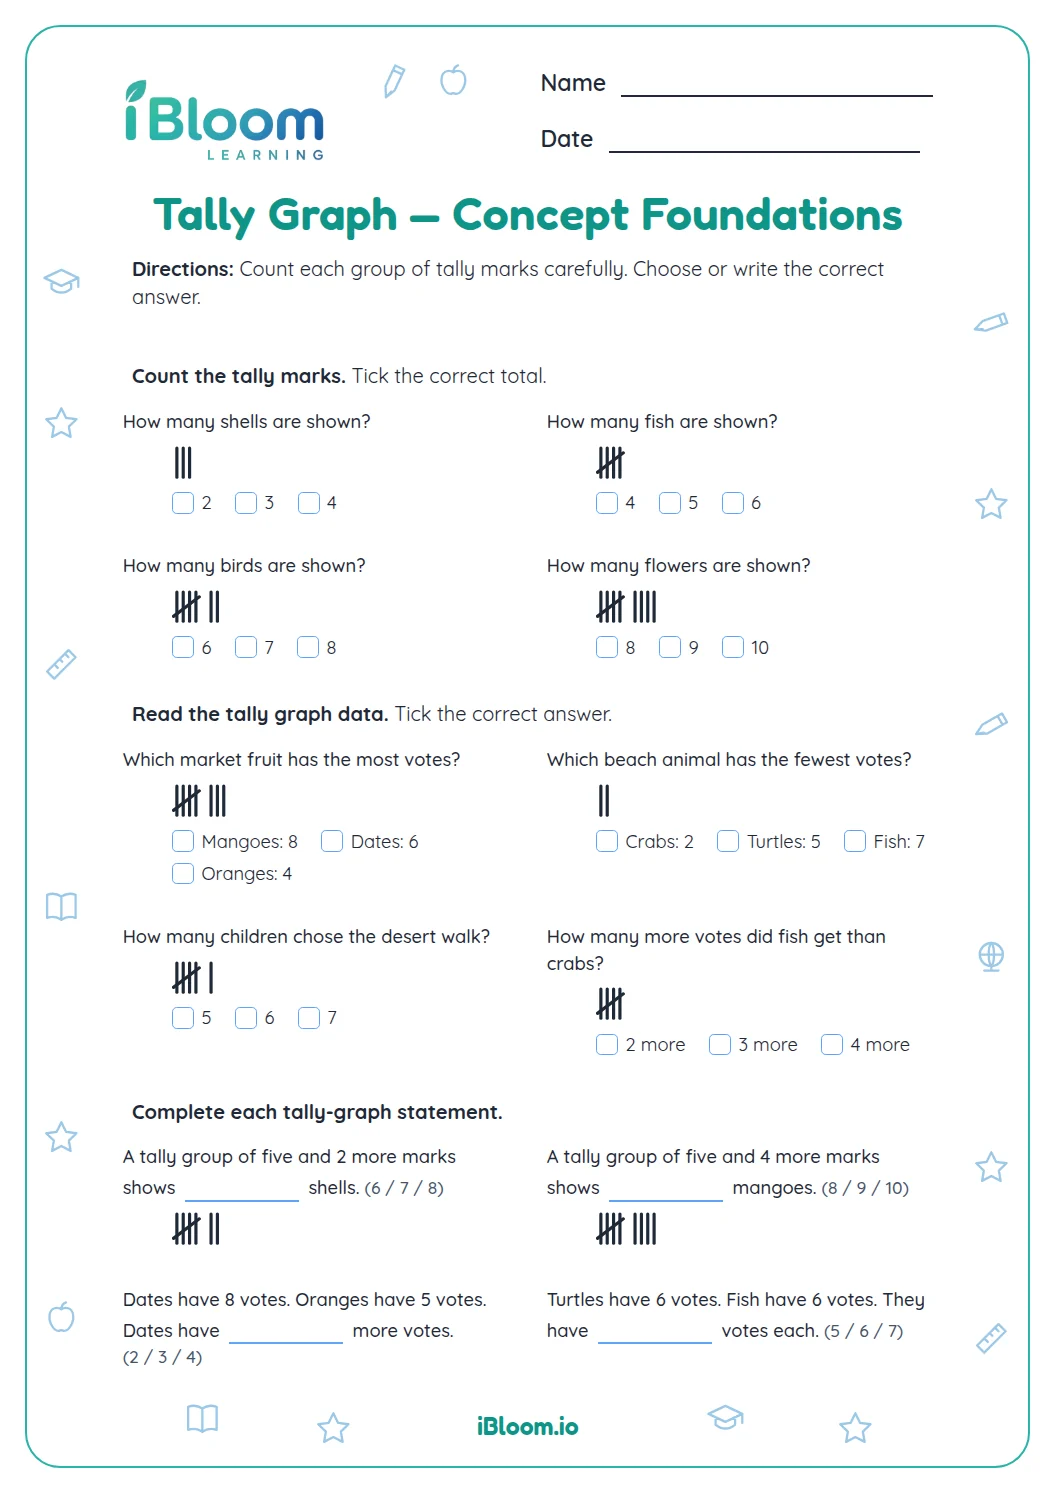 Tally Graph — Concept FoundationsConcept Foundations for tally graph in Grade 3. Read tally marks, count totals, compare categories, and answer simple tally-graph questions.Grade 3Free PDF preview
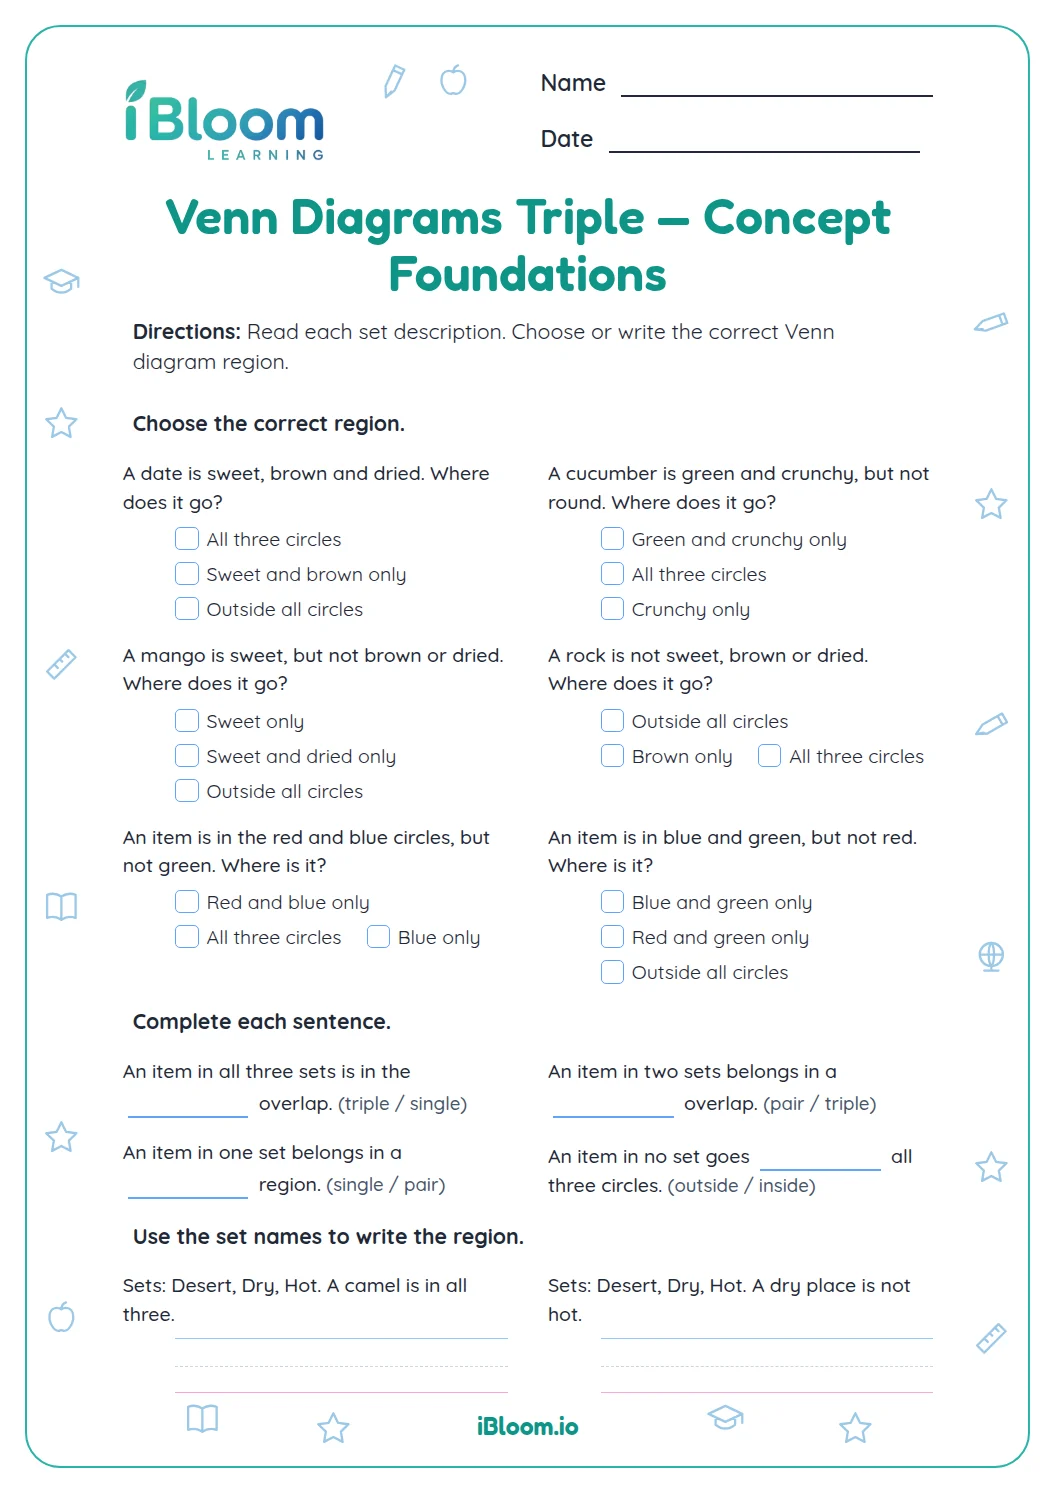 Venn Diagrams Triple — Concept FoundationsConcept Foundations for venn diagrams triple in Grade 3. Identify which of three overlapping sets each object belongs to, then name triple-overlap, pair-overlap, single-set, and outside regions.Grade 3Free PDF preview
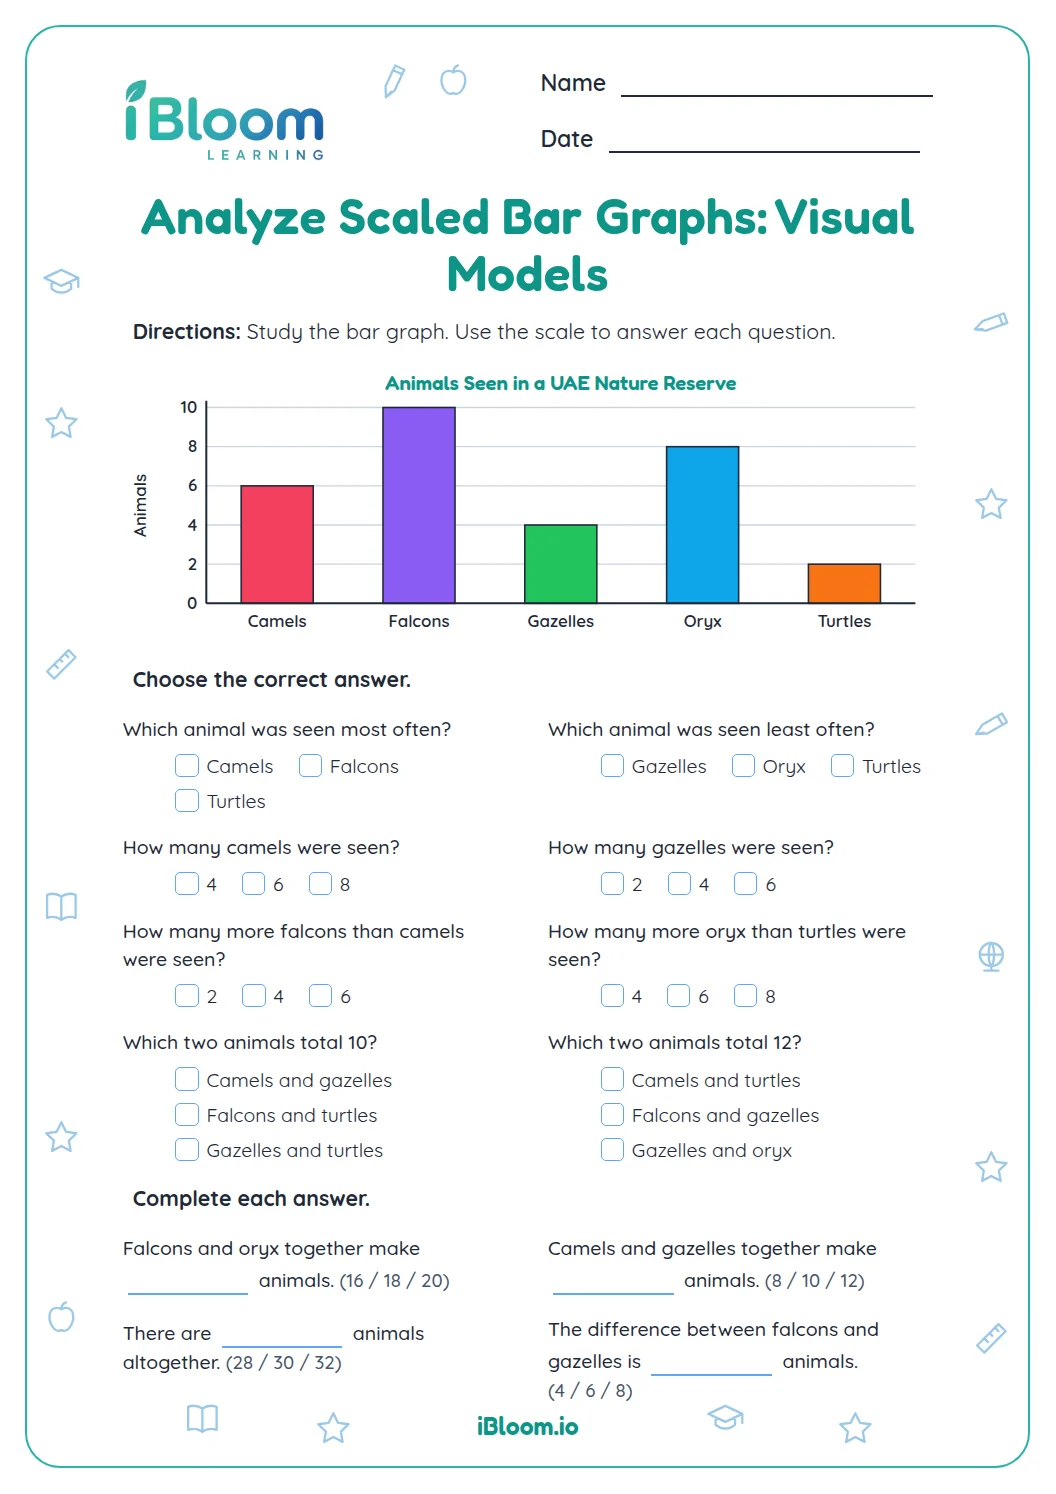 Analyze Scaled Bar Graphs — Visual ModelsVisual Models for analyze scaled bar graphs in Grade 3. Read the scaled bar graph, use its key, and answer comparison, total, and difference questions.Grade 3Free PDF preview
 Circle Graphs — Visual ModelsVisual Models for circle graphs in Grade 3. Read fraction models, identify equal parts, and use them to answer simple circle-graph questions.Grade 3Free PDF preview
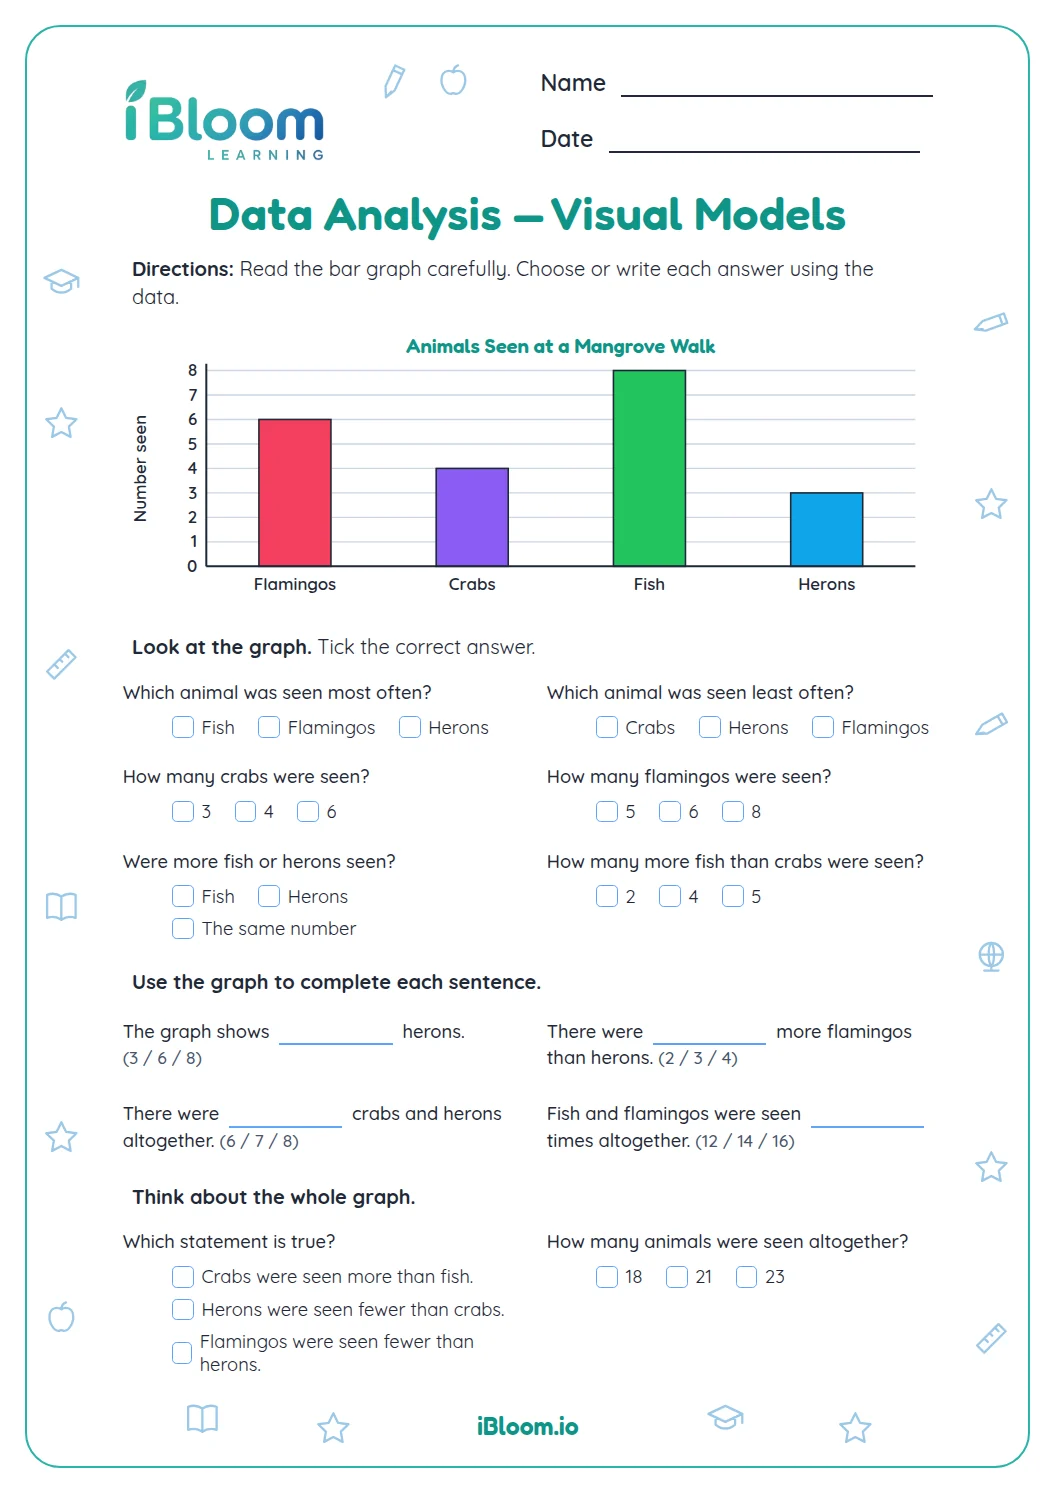 Data Analysis — Visual ModelsVisual Models for data analysis in Grade 3. Read the mangrove bar graph, compare categories, and use the data to answer questions.Grade 3Free PDF preview
 Data Collection — Visual ModelsVisual Models for data collection in Grade 3. Read tally and bar models, collect responses, and choose or complete the correct data totals.Grade 3Free PDF preview
 Labelling Graphs — Visual ModelsVisual Models for labelling graphs in Grade 3. Read two bar graphs and choose the correct titles, axis labels, scale, units, and key information.Grade 3Free PDF preview
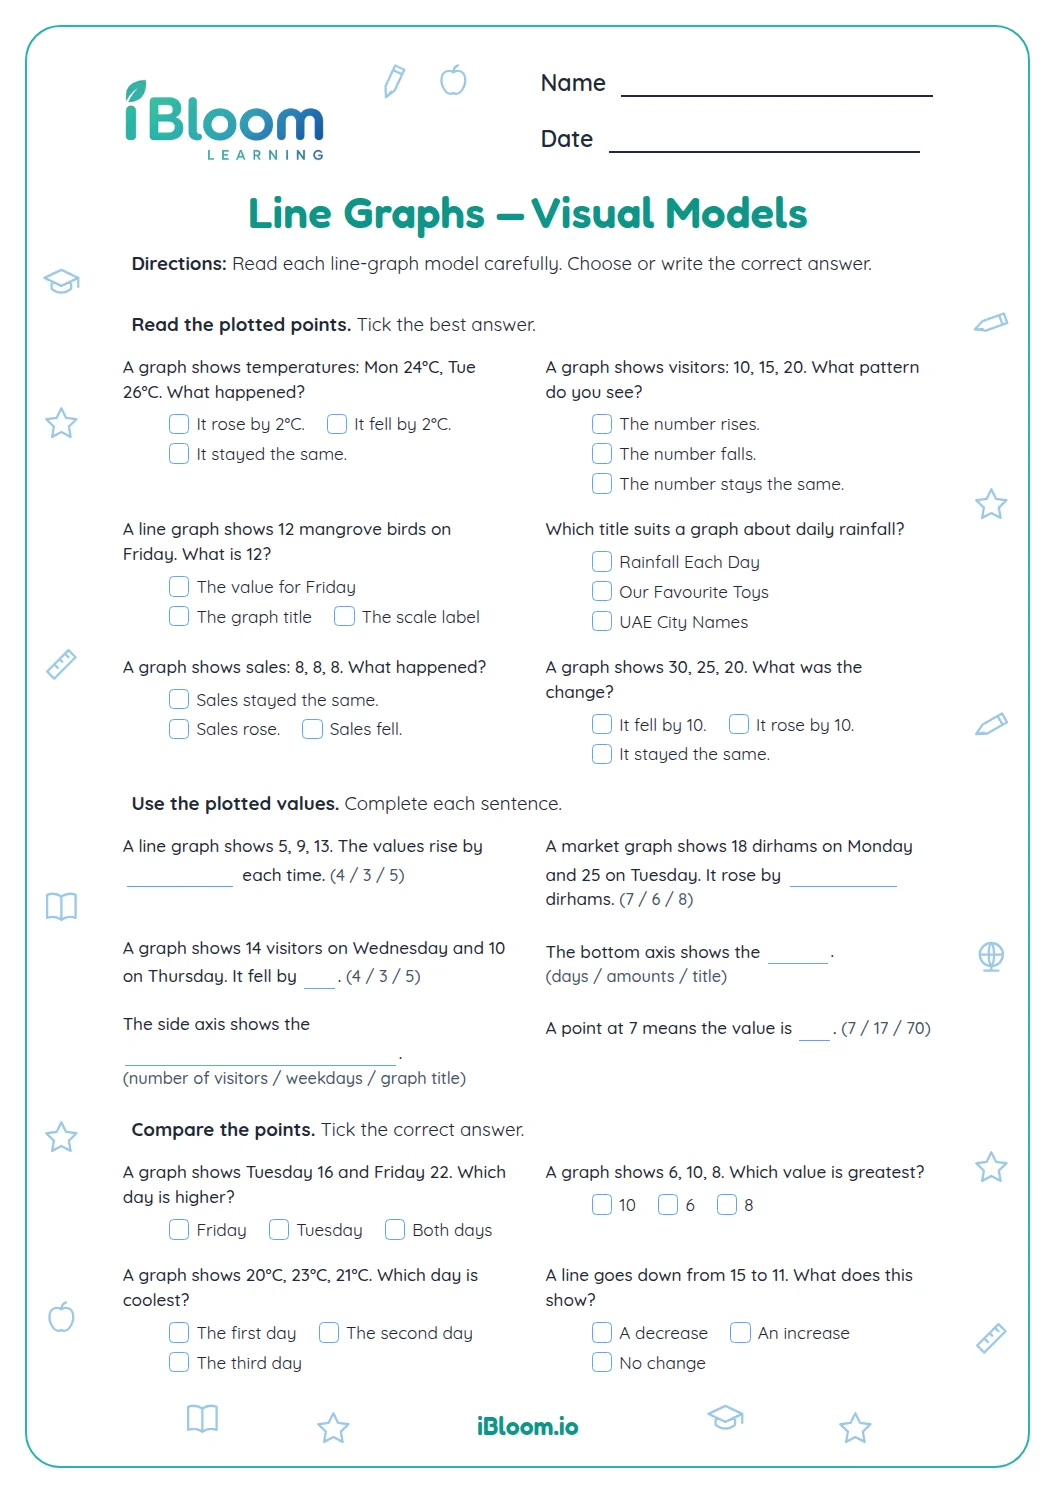 Line Graphs — Visual ModelsVisual Models for line graphs in Grade 3. Read plotted points in simple line-graph models, then identify titles, axes, scales, values, and changes.Grade 3Free PDF preview
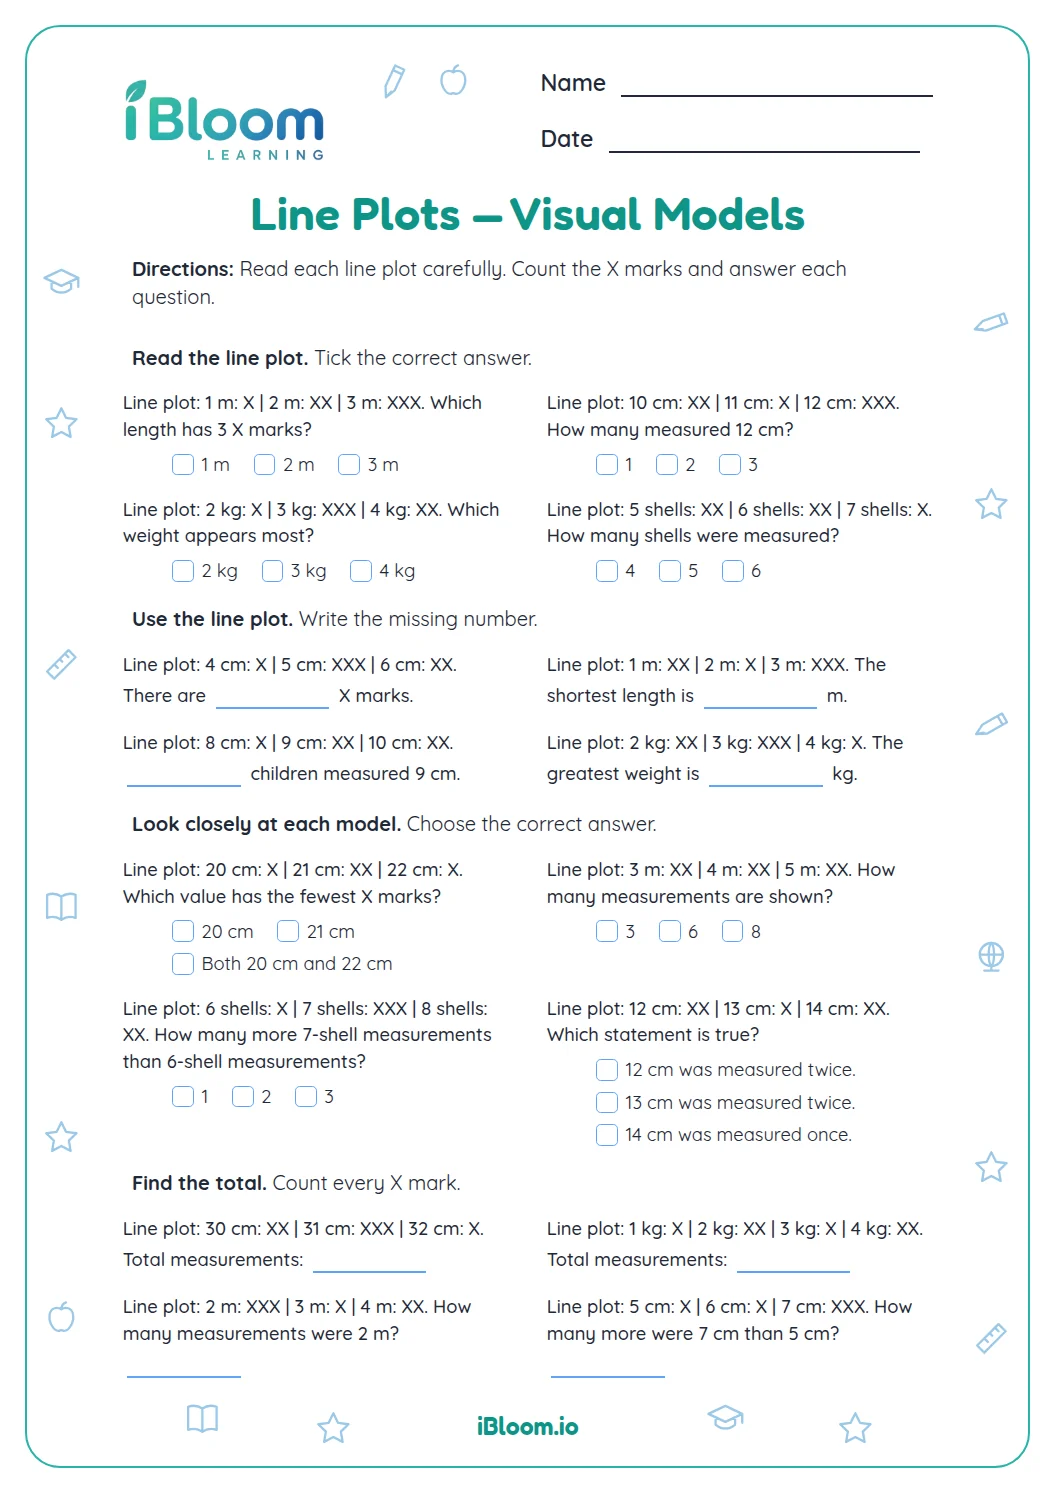 Line Plots — Visual ModelsVisual Models for line plots in Grade 3. Read visual line plots with X marks, find frequencies and totals, and compare measured values.Grade 3Free PDF preview
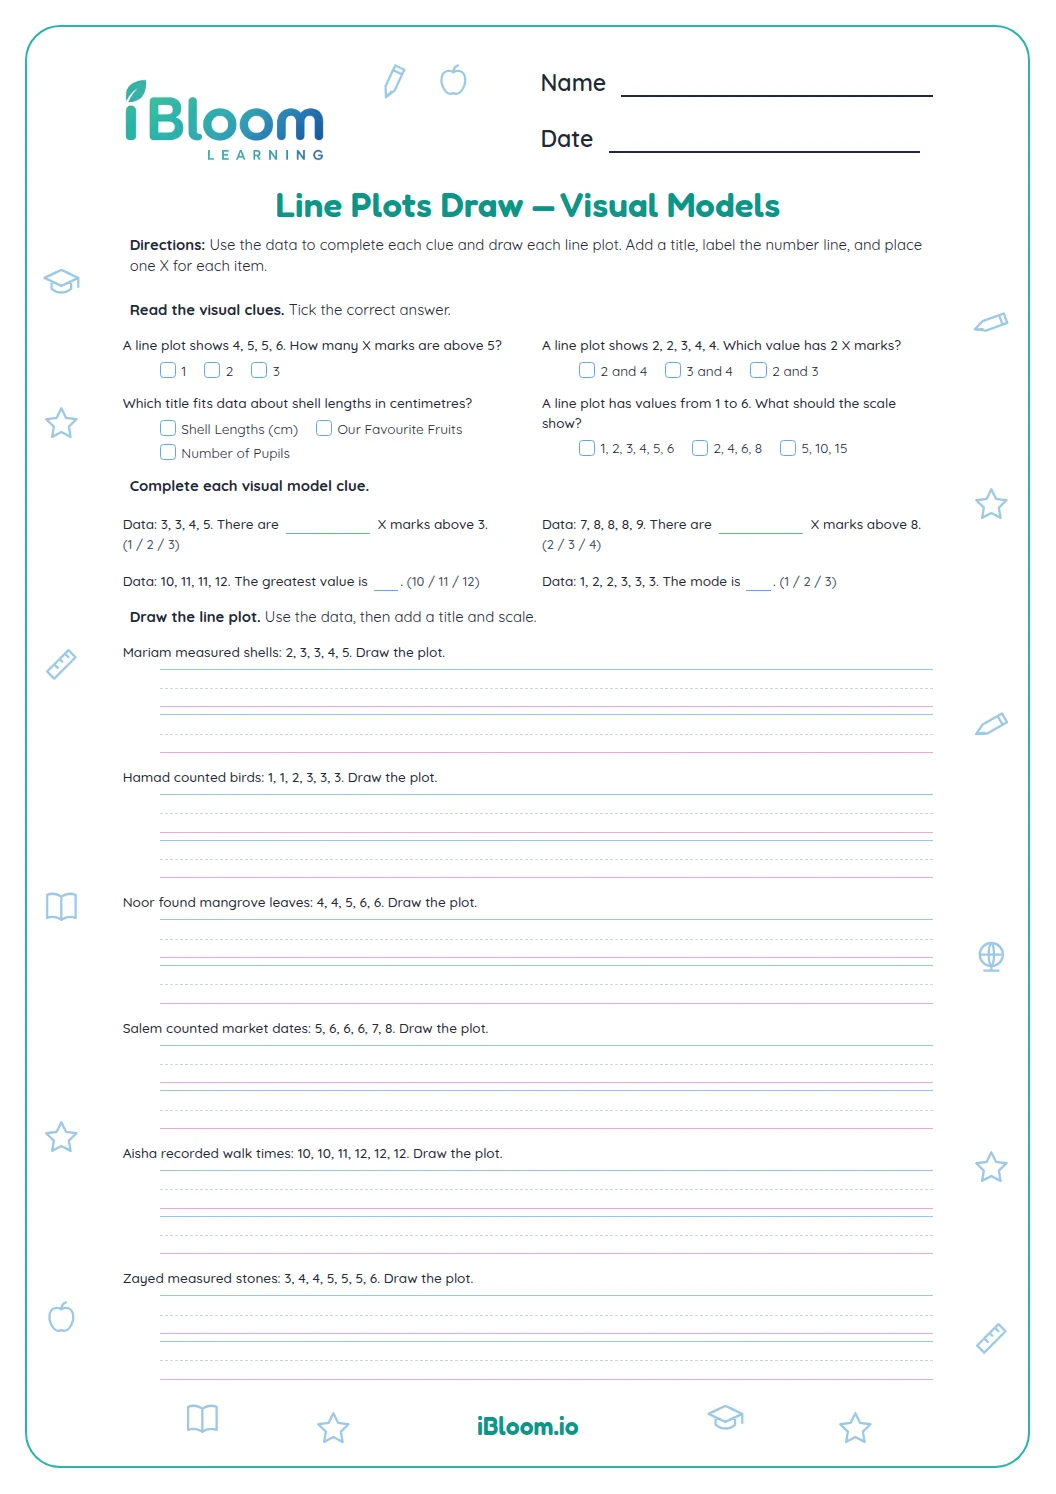 Line Plots Draw — Visual ModelsVisual Models for line plots draw in Grade 3. Read small data sets, complete visual-model clues, and draw line plots with titles, scales, and X marks.Grade 3Free PDF preview
Practice that builds confidence
Practise Data Graphing
Grade 3 students practise collecting, displaying, labelling, and interpreting data with line plots, pictographs, bar graphs, Venn diagrams, and more.
Grade 3 students practise collecting, displaying, labelling, and interpreting data with line plots, pictographs, bar graphs, Venn diagrams, and more.
Explore printable data graphing worksheets for UAE learners. Choose a focused activity that suits the child's stage, model the first example together, and discuss how the child found the answer.

Using a worksheet well
Begin with a short explanation and one worked example. Let the child complete a manageable section, then ask them to explain their answer or show another method. For younger learners, pair the page with real objects, pictures, talk and play. If an item is difficult, return to the prerequisite skill and try again later.
Helpful answers
Frequently asked questions
How should I use these worksheets?
Choose a page that matches the current skill, model one example, and discuss the answers together.
Can I print a worksheet?
Yes. Open a published activity to preview its full printable page before printing.