Free printable practice
Data Graphing Practice Activities
Printable Grade 5 data graphing worksheets for interpreting, creating, and comparing line graphs, bar graphs, plots, averages, probability, and circle graphs.
Explore Data Graphing
Free printable worksheet PDFs
Preview every available page, then download the free worksheet PDF for home, homeschool, tutoring, or classroom practice.
Preview the exact activity before downloading it.
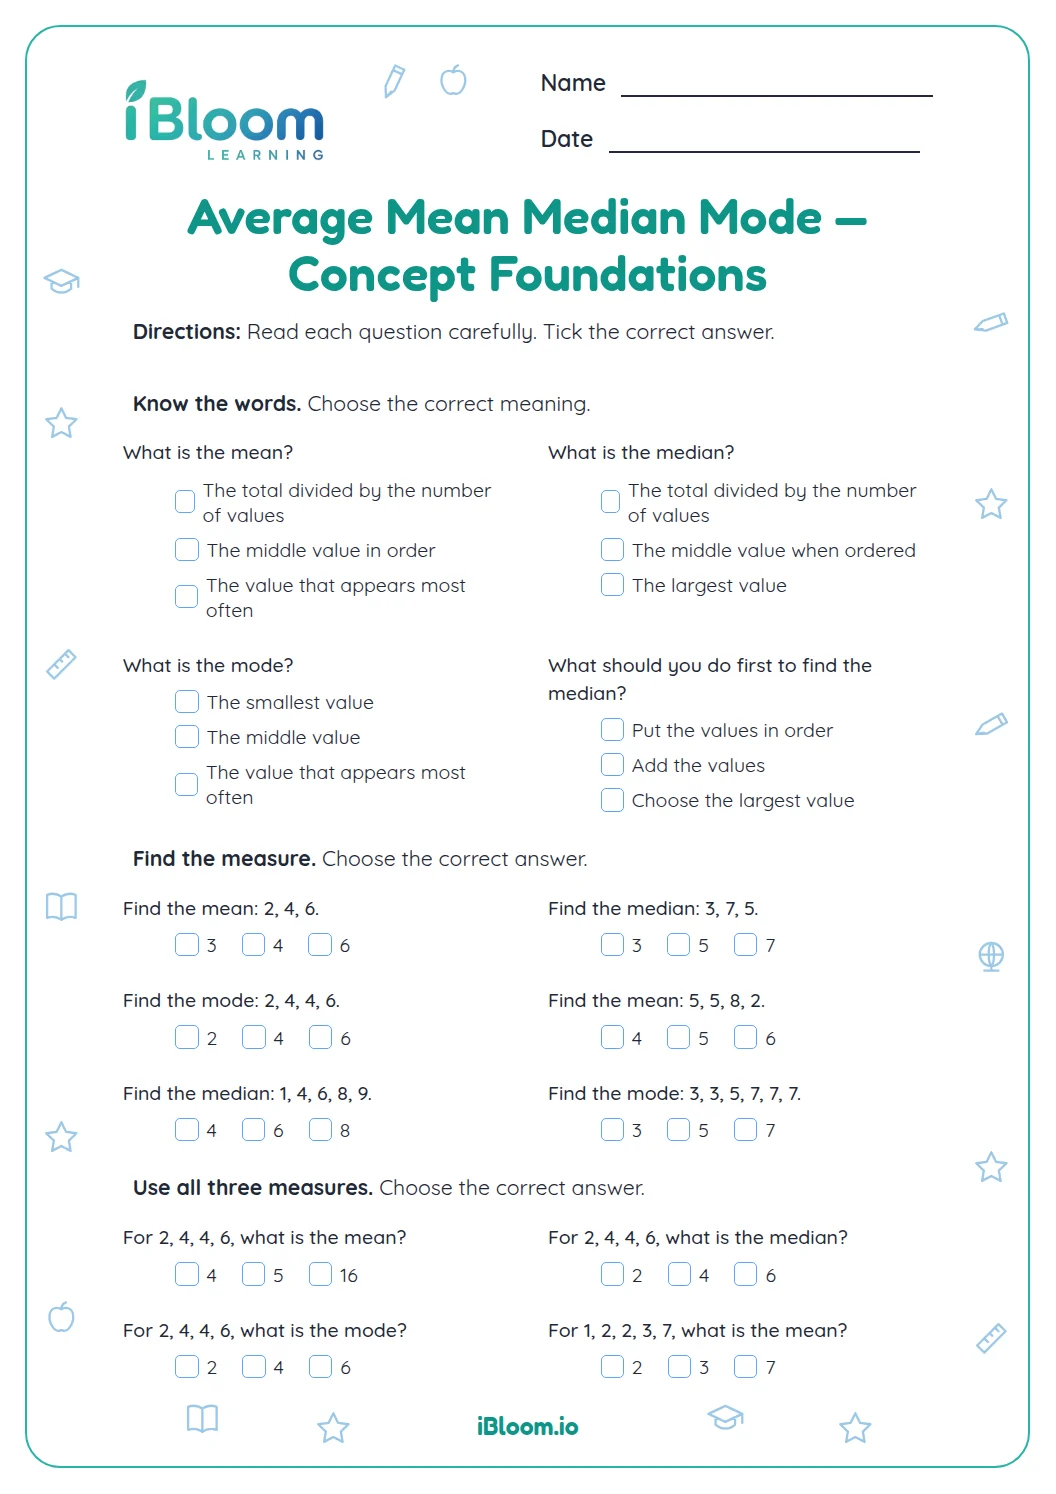 Average Mean Median Mode — Concept FoundationsConcept Foundations for average mean median mode in Grade 5. Choose the meanings of mean, median and mode, then find each measure in simple number sets.Grade 5Free PDF preview
 Circle Graph Fractions — Concept FoundationsConcept Foundations for circle graph fractions in Grade 5. Read each divided-circle description, identify the fraction for a category, compare fractions, and explain what the parts show.Grade 5Free PDF preview
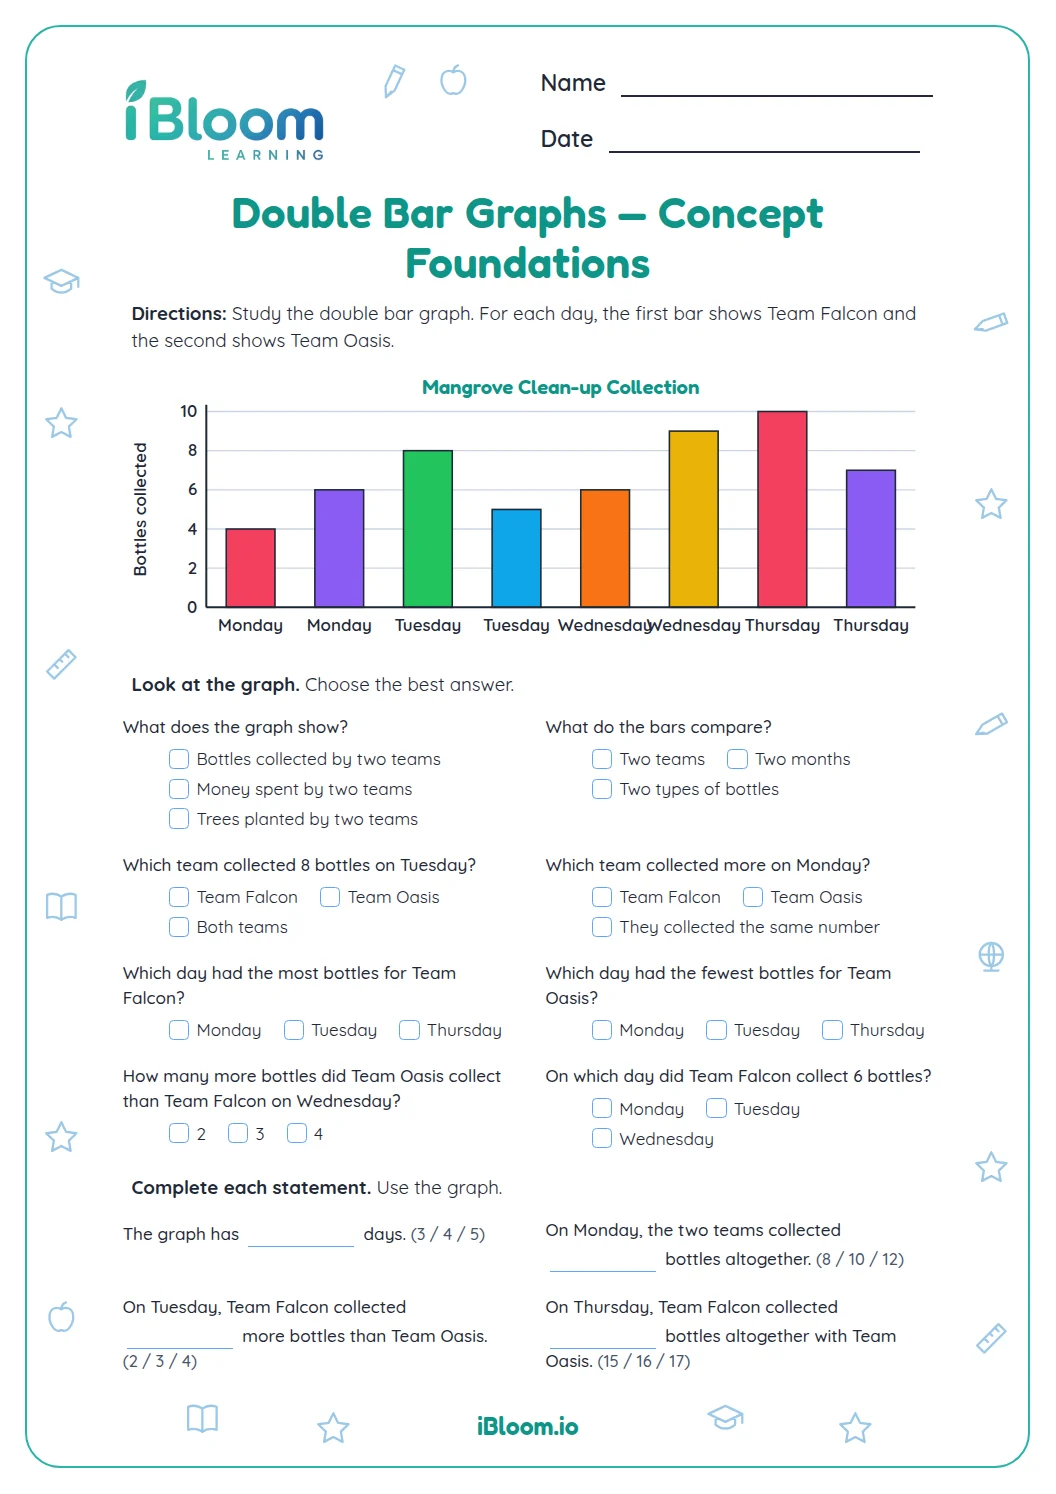 Double Bar Graphs — Concept FoundationsConcept Foundations for double bar graphs in Grade 5. Read a double bar graph, identify its parts, compare paired bars, and solve simple totals and differences.Grade 5Free PDF preview
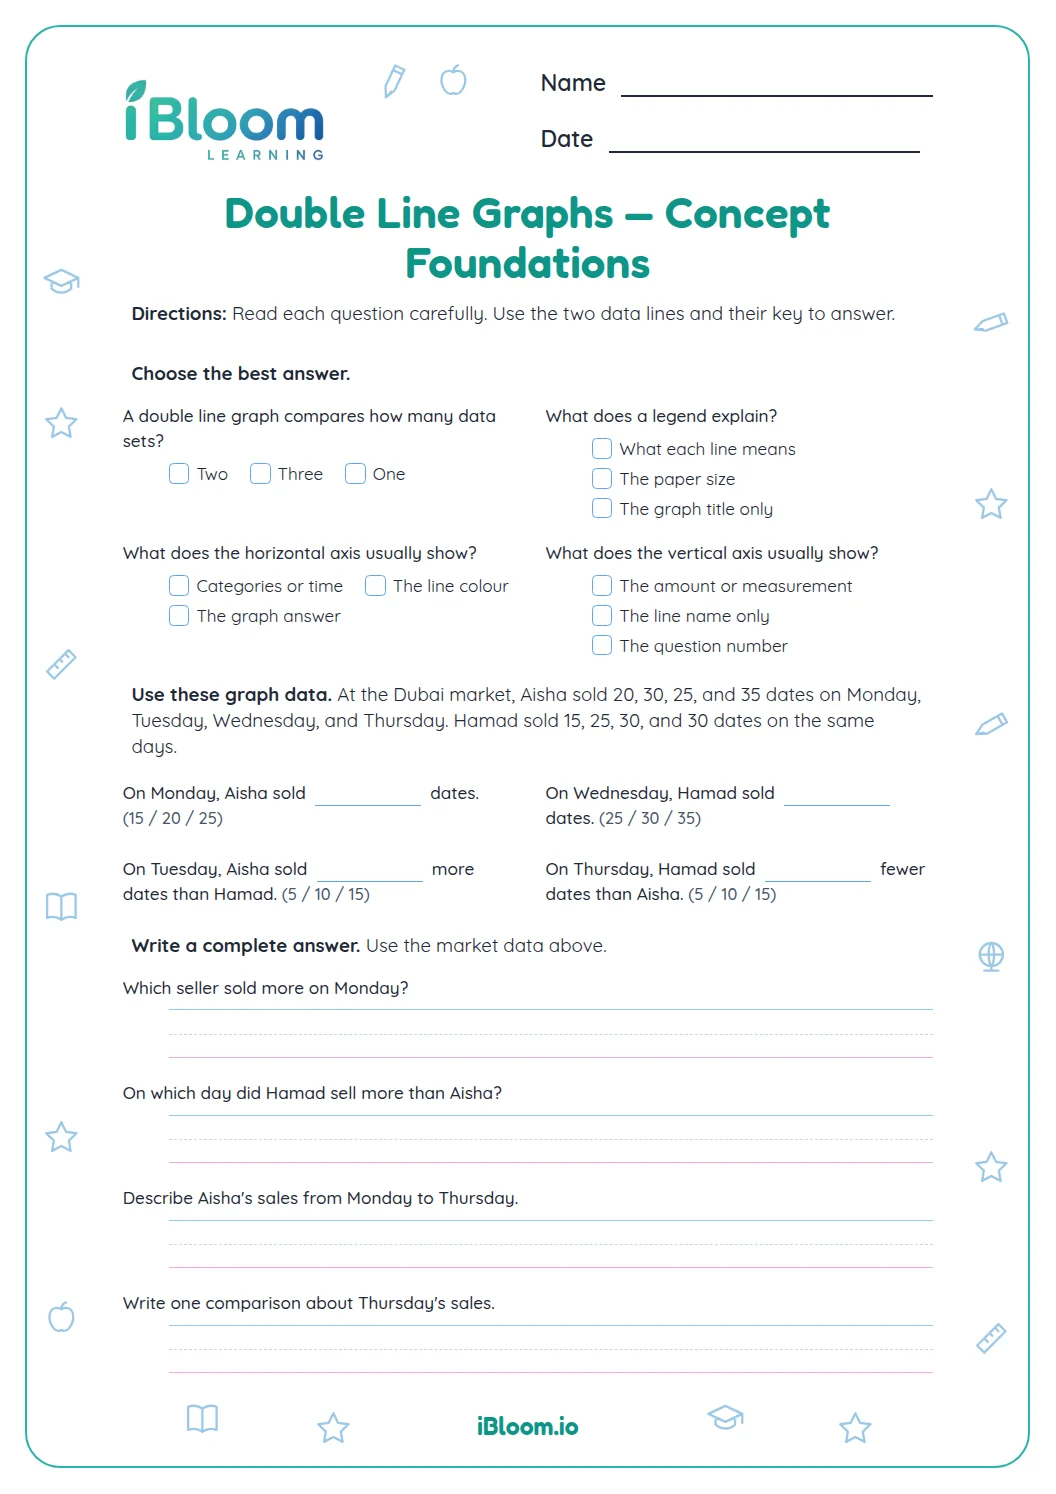 Double Line Graphs — Concept FoundationsConcept Foundations for double line graphs in Grade 5. Identify the title, legend, scale, points, comparisons, and trends in a double line graph, then describe graph data.Grade 5Free PDF preview
 Line Plot Fractions — Concept FoundationsConcept Foundations for line plot fractions in Grade 5. Read simple fraction line plots, identify values and frequencies, and answer beginner questions about the data.Grade 5Free PDF preview
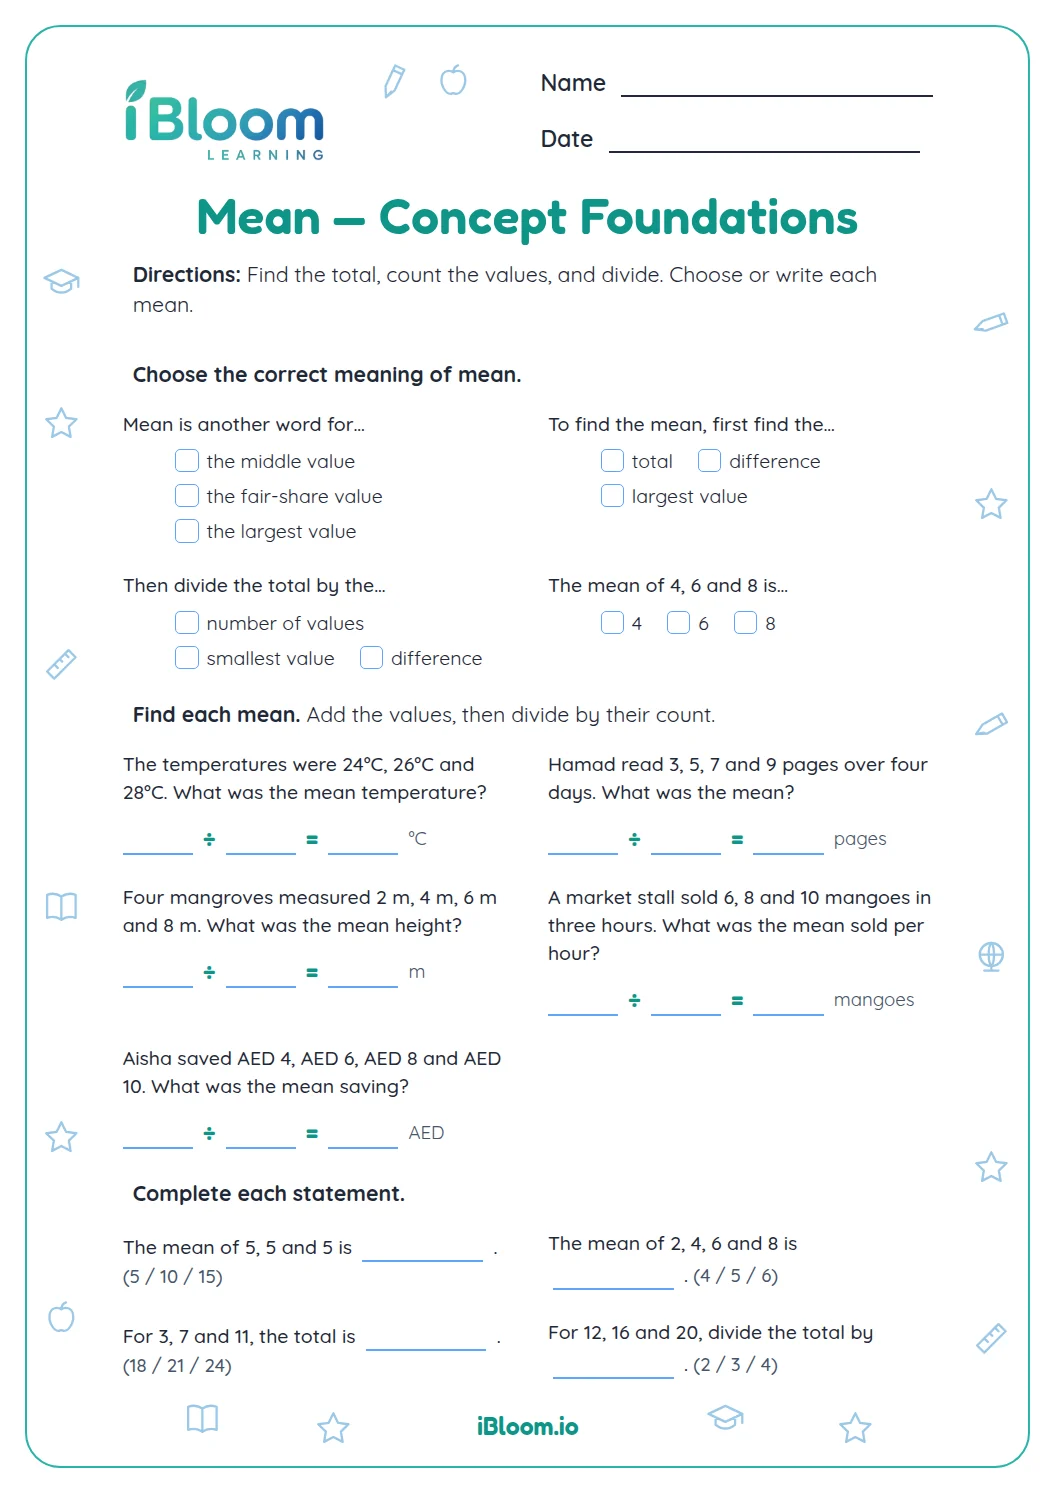 Mean — Concept FoundationsConcept Foundations for mean in Grade 5. Identify mean as a fair-share value, find totals and group counts, then calculate means by dividing the total by the number of values.Grade 5Free PDF preview
 Probability — Concept FoundationsConcept Foundations for probability in Grade 5. Classify everyday events as impossible, unlikely, equally likely, likely, or certain, and compare simple chances.Grade 5Free PDF preview
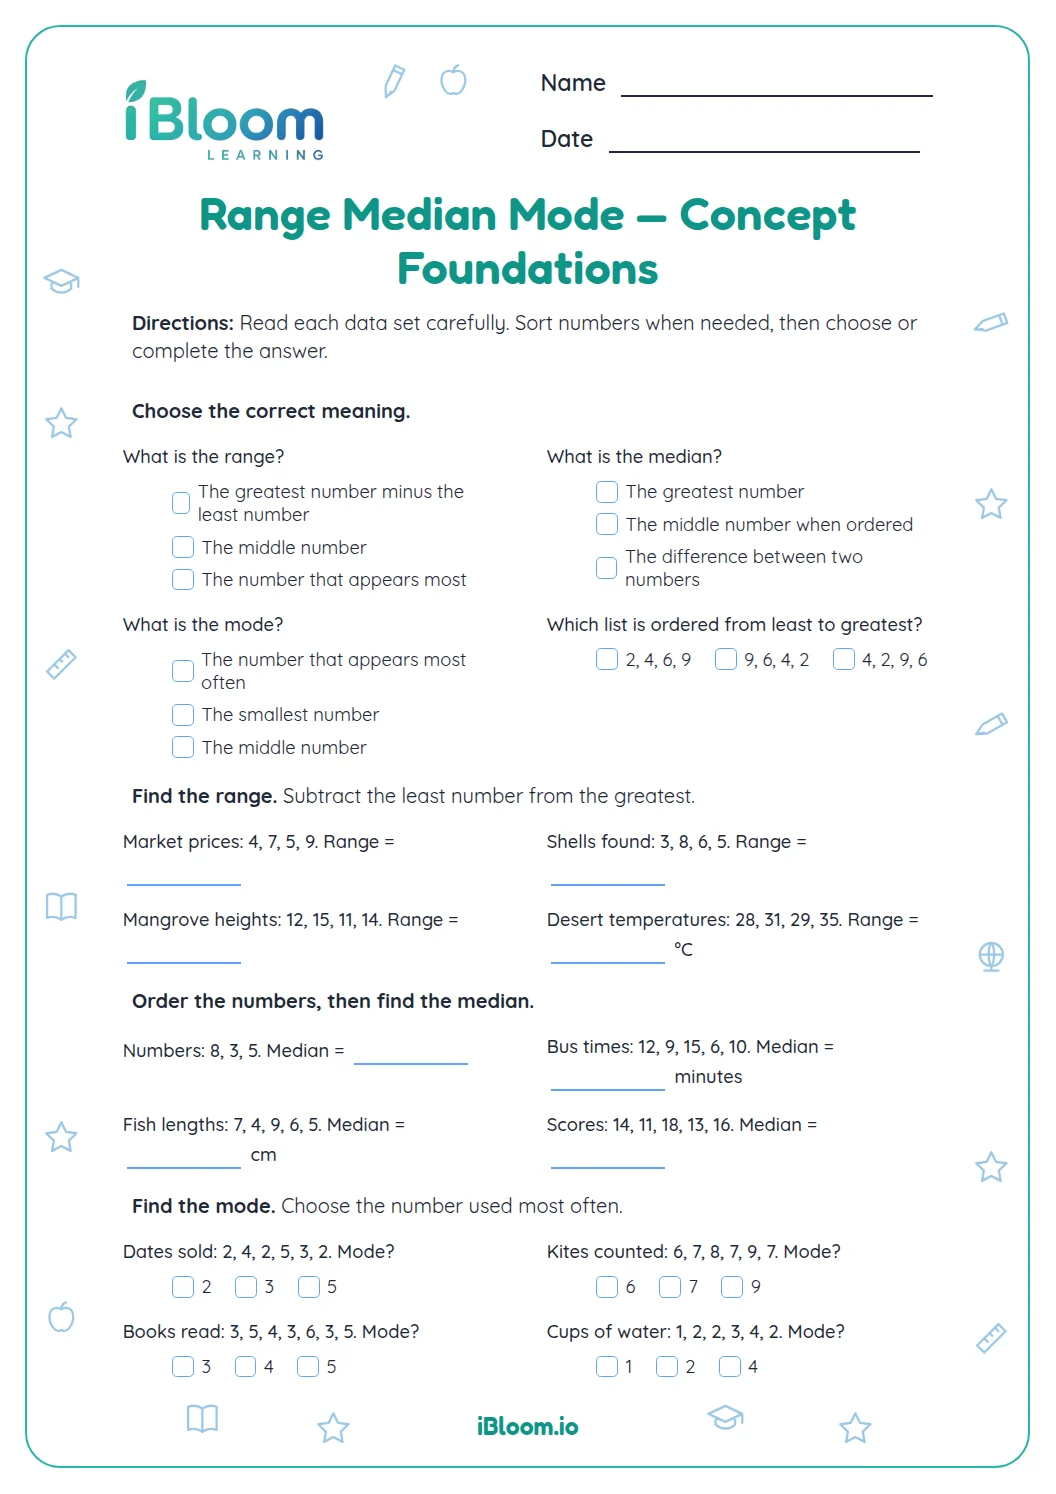 Range Median Mode — Concept FoundationsConcept Foundations for range median mode in Grade 5. Sort each data set, then find and identify its range, median, or mode.Grade 5Free PDF preview
 Range Mode — Concept FoundationsConcept Foundations for range mode in Grade 5. Find the largest and smallest values, subtract to find each range, and identify the number that appears most often as the mode.Grade 5Free PDF preview
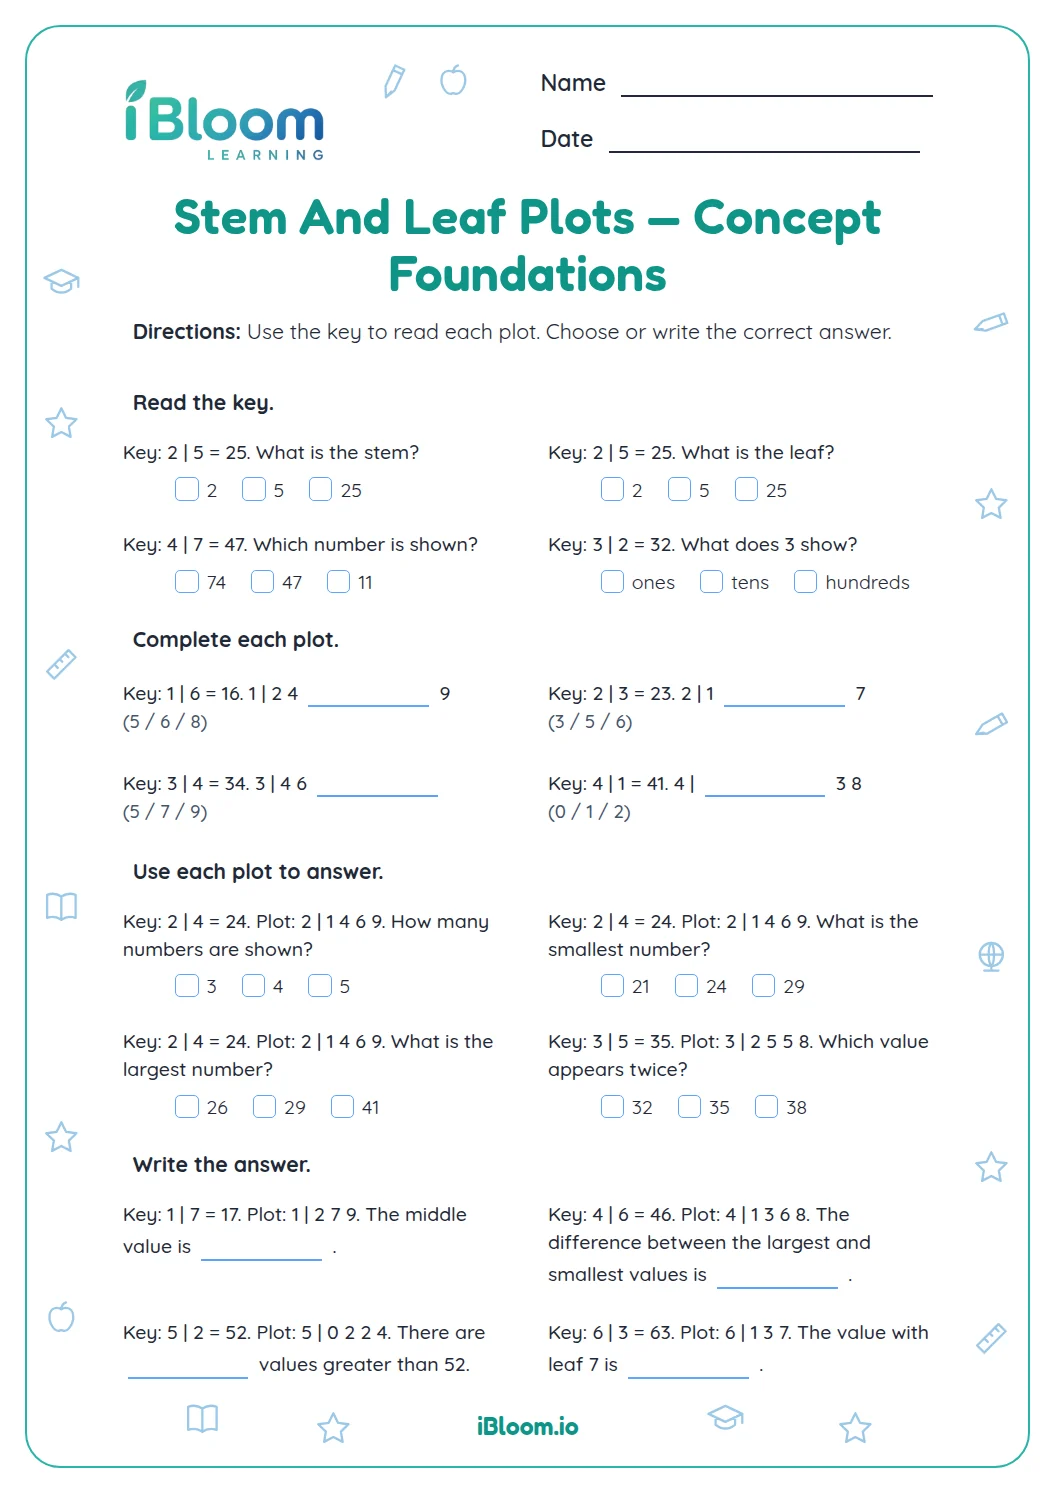 Stem And Leaf Plots — Concept FoundationsConcept Foundations for stem and leaf plots in Grade 5. Read simple stem-and-leaf plots, use the key to find values, complete missing leaves, and answer questions about the data.Grade 5Free PDF preview
 Average Mean Median Mode — Visual ModelsVisual Models for average mean median mode in Grade 5. Use number sets and simple visual-style data lists to identify and calculate the mean, median, and mode.Grade 5Free PDF preview
 Circle Graph Fractions — Visual ModelsVisual Models for circle graph fractions in Grade 5. Read shaded visual models, identify the fractions they show, compare parts, and explain the whole.Grade 5Free PDF preview
 Double Bar Graphs — Visual ModelsVisual Models for double bar graphs in Grade 5. Read one double bar graph, compare the paired bars, and answer questions using the visual data.Grade 5Free PDF preview
 Double Line Graphs — Visual ModelsVisual Models for double line graphs in Grade 5. Read a paired-data model, identify legend and scale information, compare two lines, complete missing values, and describe trends.Grade 5Free PDF preview
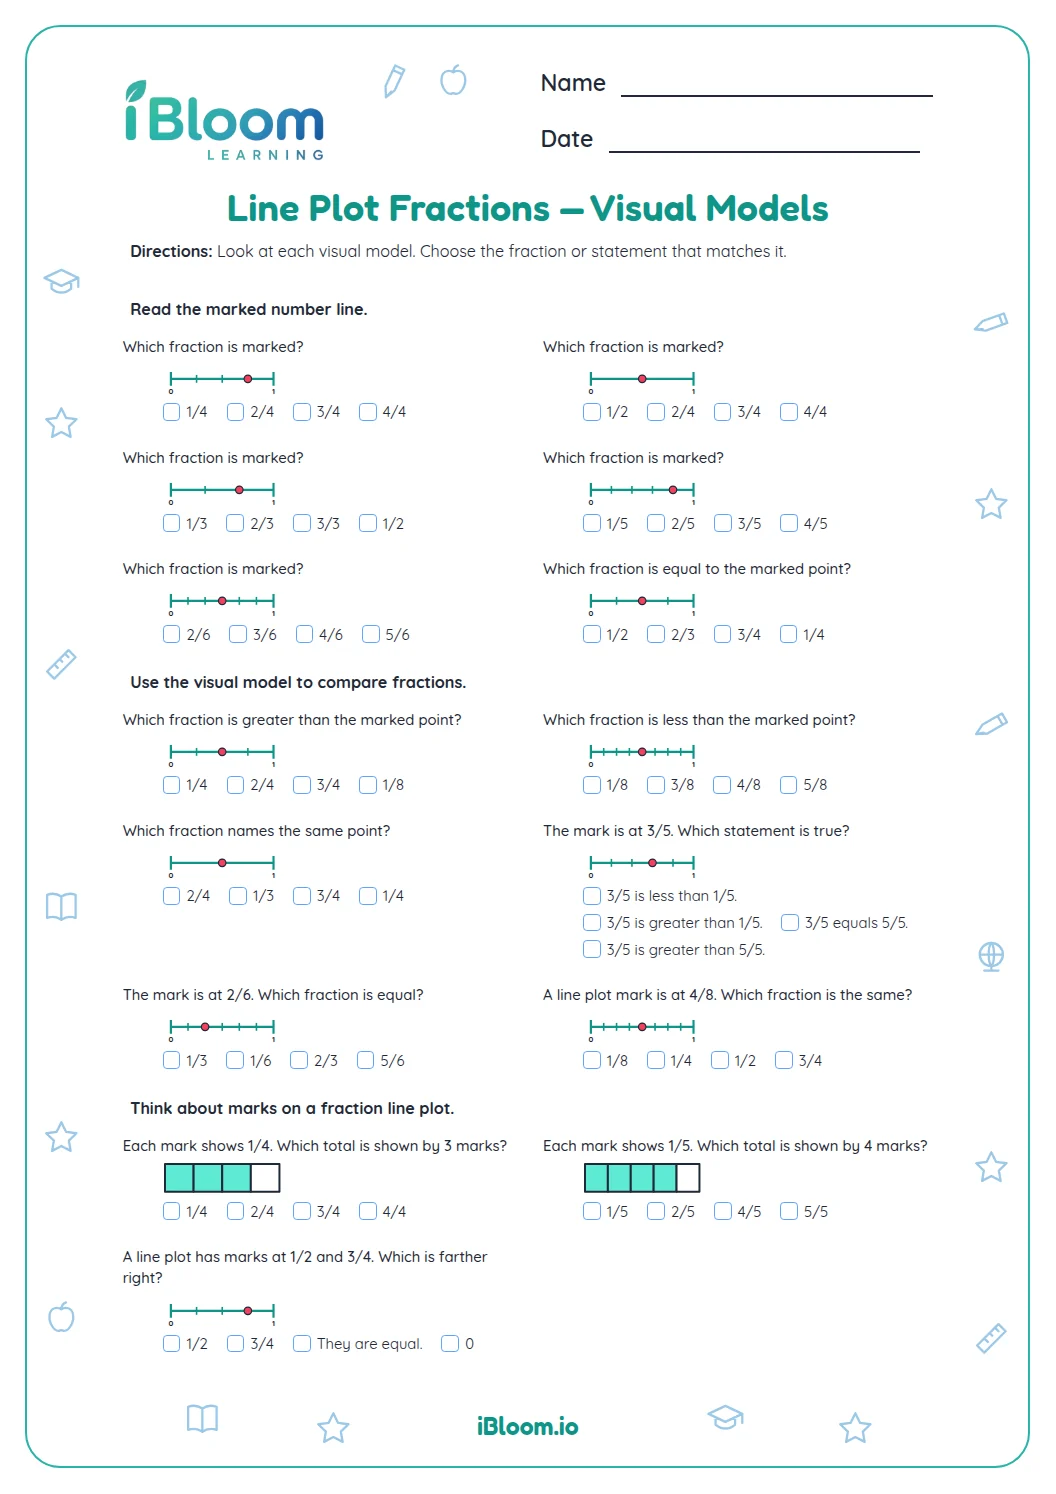 Line Plot Fractions — Visual ModelsVisual Models for line plot fractions in Grade 5. Read visual fraction models, identify positions on marked number lines, and interpret simple line-plot data.Grade 5Free PDF preview
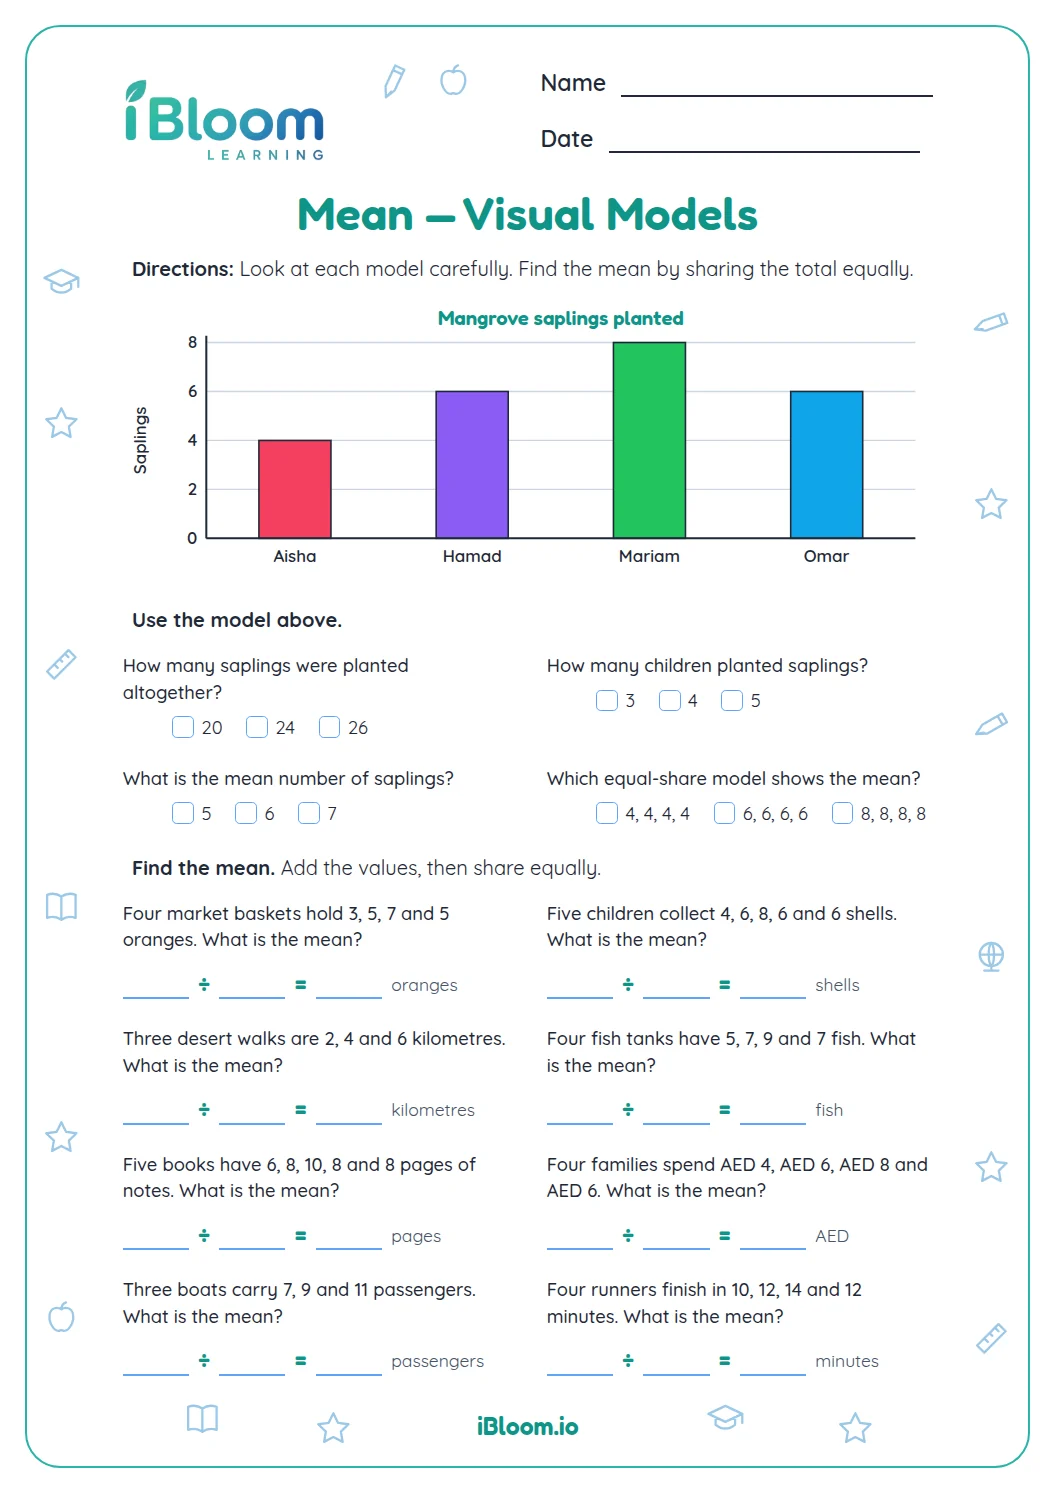 Mean — Visual ModelsVisual Models for mean in Grade 5. Read each bar model, find the total, share it equally, and choose or calculate the mean.Grade 5Free PDF preview
 Probability — Visual ModelsVisual Models for probability in Grade 5. Interpret visual probability models, compare chances, and identify certain, likely, unlikely, and impossible outcomes.Grade 5Free PDF preview
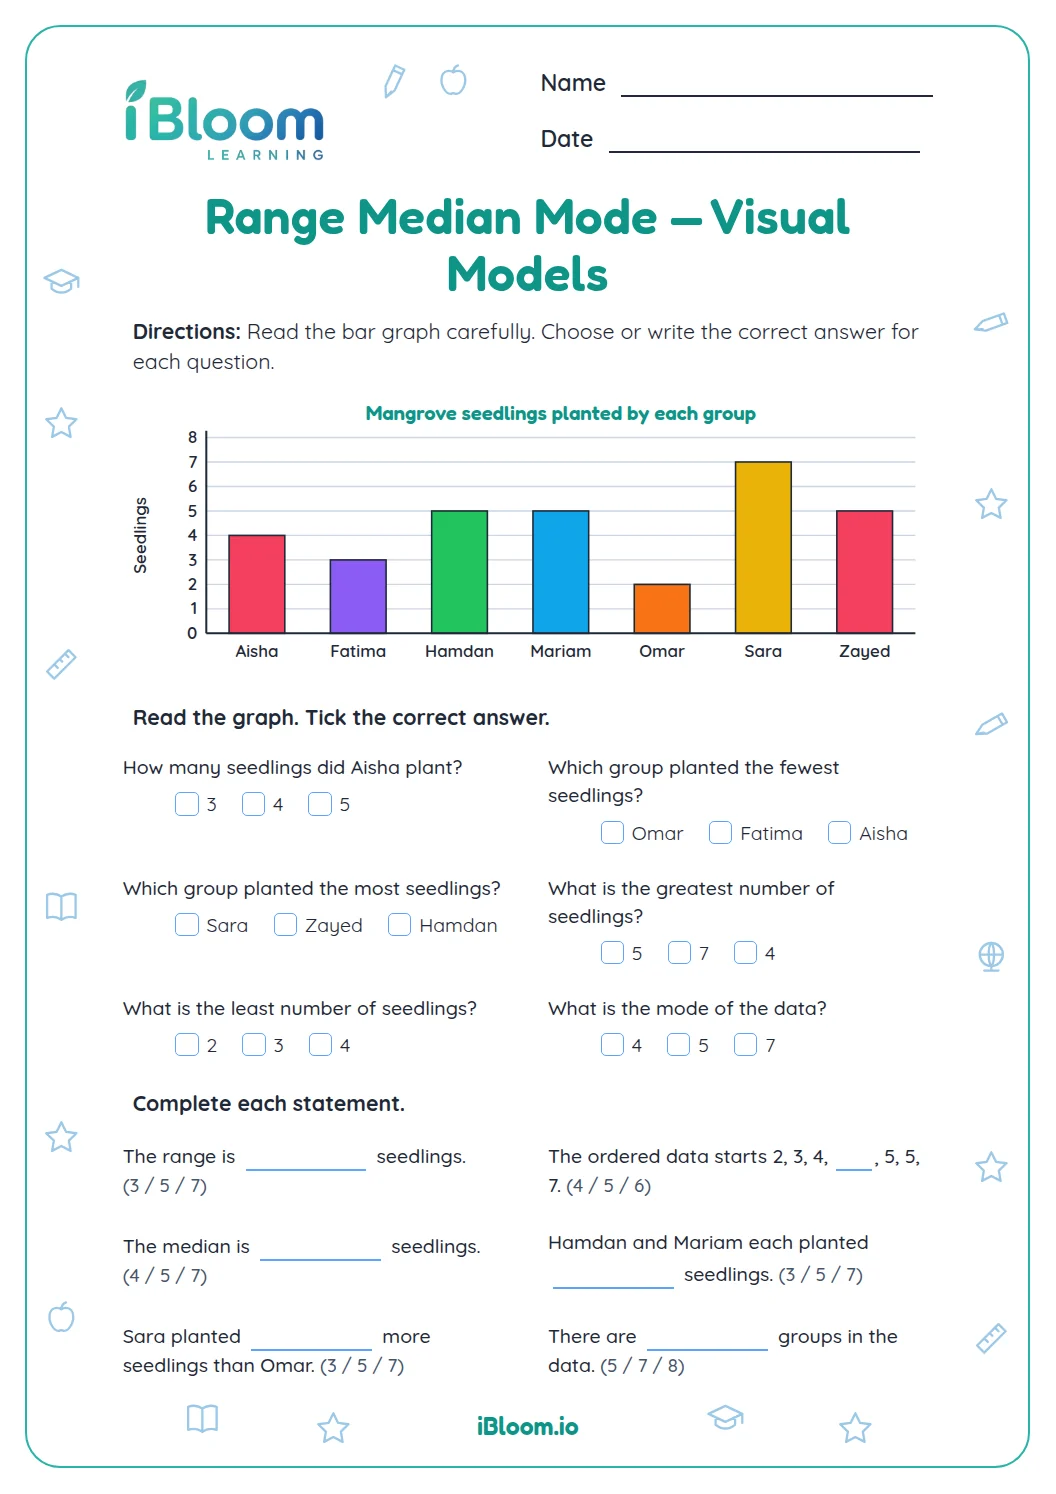 Range Median Mode — Visual ModelsVisual Models for range median mode in Grade 5. Read the bar graph, identify the least, greatest, median and mode values, and calculate the range.Grade 5Free PDF preview
 Range Mode — Visual ModelsVisual Models for range mode in Grade 5. Read each bar model, identify the least and greatest values, find the mode, and calculate the range.Grade 5Free PDF preview
 Stem And Leaf Plots — Visual ModelsVisual Models for stem and leaf plots in Grade 5. Read simple data sets, match them to stem-and-leaf plots, and complete missing stems or leaves.Grade 5Free PDF preview
Practice that builds confidence
Practise Data Graphing
Printable Grade 5 data graphing worksheets for interpreting, creating, and comparing line graphs, bar graphs, plots, averages, probability, and circle graphs.
Printable Grade 5 data graphing worksheets for interpreting, creating, and comparing line graphs, bar graphs, plots, averages, probability, and circle graphs.
Explore printable data graphing worksheets for UAE learners. Choose a focused activity that suits the child's stage, model the first example together, and discuss how the child found the answer.

Using a worksheet well
Begin with a short explanation and one worked example. Let the child complete a manageable section, then ask them to explain their answer or show another method. For younger learners, pair the page with real objects, pictures, talk and play. If an item is difficult, return to the prerequisite skill and try again later.
Helpful answers
Frequently asked questions
How should I use these worksheets?
Choose a page that matches the current skill, model one example, and discuss the answers together.
Can I print a worksheet?
Yes. Open a published activity to preview its full printable page before printing.